ZEC 8h - Bullish. ZEC has started a bullish trend way ahead of the big boys - Once we see a major pump in BTC I would reckon ZEC would perform even better then now.
I would keep an eye out for a decent pull back to key levels and it should be onwards and upwards.
ZECUSDT.P trade ideas

ZEC 62% setupZEC will get network update this april. Cumulative delta in positive right now, we can see huge purchases clusters.
All the anon cash segment is alive right now. ZEC is old and heavy project, so it's hard to pump.
I expected $180 target, but at this moment $200 and $220 looks possible.
If you are interested in anon cash, check TORN project. It's new and easy to pump, so we will see more volatility and more profits there.


Zcash Reanalysis: Wyckoff DistributionYou can take a long position now and expect it to make a new high to 167 . If the buyers' strength are powerful enough, it could even break above 170 . But anyways, if the Wyckoff Distribution plays out, you can expect it to range for quite a while before making a huge drop down to around 128 or even further. You can take advantage of this ranging market, so don't miss out on Zcash moves.

Possible Wyckoff Distribution for this privacy coin, Zcash.ZEC had been literally skyrocketing in recent days. However, the Accumulation/Distribution indicator seems to show that ZEC has entered the distribution phase. ZEC also seems to have formed a possible Wyckoff Distribution, and has failed to climb above 167 . If you are looking to short, short at around 160 .
(Just an opinion!)

ZEC/USDTwaiting to finish retesting i think price will touch 125 1st before moving up again
golden cross about to be


Bulls receive a rejection from the $160 mark The Zcash coin has been slipping lower since beginning of this week and has lost almost 9.8% in just 3 days in price.
The market cap of the ZEC token is down 8.7% over the last night, which is now $1.9 billion.
Panic sellers are approaching the 200-day moving average on the daily price chart. If the bears manage to close today's price candle below the 200-MA, the remaining MA could act as a support level for the buyers.
Stoch RSI is retreating from the overbought area. The RSI is likely to bounce back from the bullish trend line (white). Furthermore, the Average Directional Index is indicating a weak bearish momentum for the ZEC coin.
Today the price of ZEC has slipped below the narrow horizontal range the coin was trading in for over 4 days. The 100-MA could act as a dominance zone for buyers for the upcoming trading sessions.
Resistance level- $190 and $300
Support level- $100 and $80
Zcash shortZcash broke trough the ascending trendline. Asset broke trough the support level. Bearish movement to support level at 113 is expected to happen.

Zcash shortZcash broke trough the ascending trendline. Asset broke trough the support level. Bearish movement to support level at 112.6 is expected to happen.

ZECUSDTHello Crypto Lovers,
Mars Signals team wishes you high profits.
We are in the daily time frame. The price broke its resistance line and after a small pullback, it moved up strongly to the next resistance zone. The price can move down to the confluence of two supports and it will range between these two areas.
Warning: This is just a suggestion and we do not guarantee profits. We advise you to analyze the chart before opening any positions.
Wish you luck

Potential Swing Bearish/Short ZEC UsdtTaking into account the current bearish nature of the market,most of the times those assets that tend to pump hugely without any logical reason except pump and dump scenarios, tend to crash the hardest as well.
I believe this asset is a strong candidate for this type of trading.
Key points:
Type of Trade : Short
Stop loss - 190 - 25% movement
Take profit - 90 - 40% movement
Capital used - 1% of the account for stop loss making a 1.6 profit factor trade in case of winning

usAnalysis ZECUSDTHello friends,
Welcome to these analyses about ZECUSDT , we take look at the 1D time frame.
Support points ( 80 )
And
Resistance points ( 170 . 240 . 320 )
Has been specified
The information is provided only for educational purposes, and should not be used to take action in the markets.
Thank you for watching the analysis
Please follow us


ZEC finishing drop. ElliotZEC ended wave 4 of correction now entering the last wave of C, final push to the down
Wave number V should have 5 waves in it
invalidation above red line, expecting to go to 90ish

ZECUSDTI want to see correction at this level followed by a strong breakout from it with volume to say that ZCash finished its bearish market and will start to record new highs
target is highlighted
zec long entry ZEC coin go long from this are its daily ema and fib line and also from 4H average signal but solid because from daily chart
keep it safe if you like zec coin and want hold this is good entry not for futures trading just my opinion
because market is crazy better for holding this coin

Zecash broke out of the ascending triangle..And retested it.
Beautiful price action, 140-145 has to hold to move further.
200+ incomming? Privacy coins are hot now.

Short ZEC Potential bearish tradeToday we have another good opportunity risk reward short entry, for this bearish market.
In this case I am looking at some anomalies(big pumps without a reason inside a bear market) and short them when I believe they are close to top/ATH
Key points:
Type of entry : Short
Take profit level 1 : 135
Take profit level 2: 120
Stops loss : 170

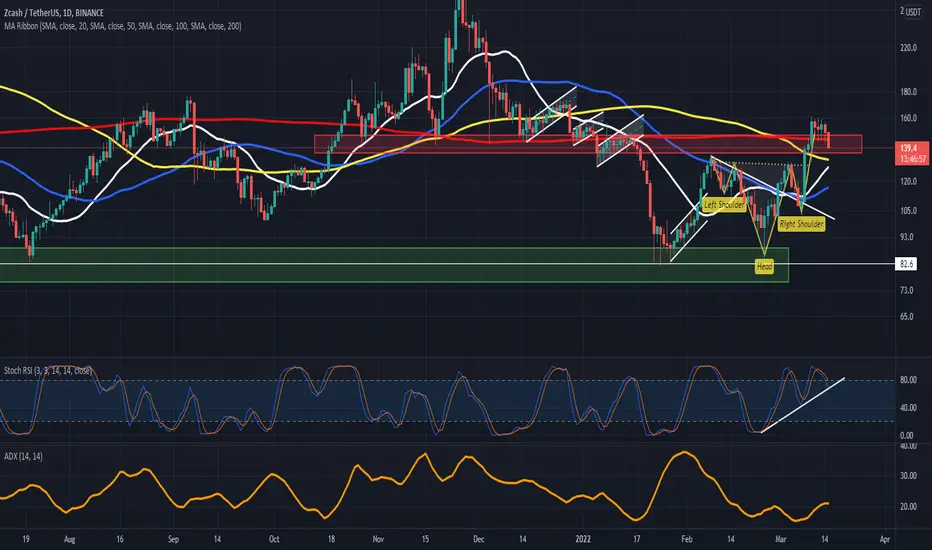
ZECUSDTDue to the concentration of prices in the support and resistance range, as well as the formation of a two-valley pattern, we expect the size of the valley to increase in price. This is just an offer and not a buy signal.
