Zcash (ZEC) Analysis Updated 07/03/2021this is an update of Zcash Analysis which we did on 01/02/2021
as we can see our Hidden Bullish Divergence Implemented, price made a rally and higher high, touched the TP Zone Green Box, where we had our 161.8% level Fibonacci projection Triggered.
price corrected itself and retraced down to the past ATH and Top of our Ascending Channel, so we got our confirmation for the 261.8% level of the same Fibonacci Projection, which is our new higher TP (250USD)
as of now we have total of 3 targets where the 1 TP is the 161.8% of the same Fibonacci Projection where it is very obvious and 2 TP is also well confirmed now.
we can target the 3 TP (315USD), after a retracement from 2TP or if the Bull pressure was high, we can simply Trill our Stop Loss and target our ultimate Target.
i have linked the previews analysis too.
ZECUSDT.P trade ideas


ZECUSDT AnalysisHello friends.
Please support my work by clicking the LIKE button(If you liked).Thank you!
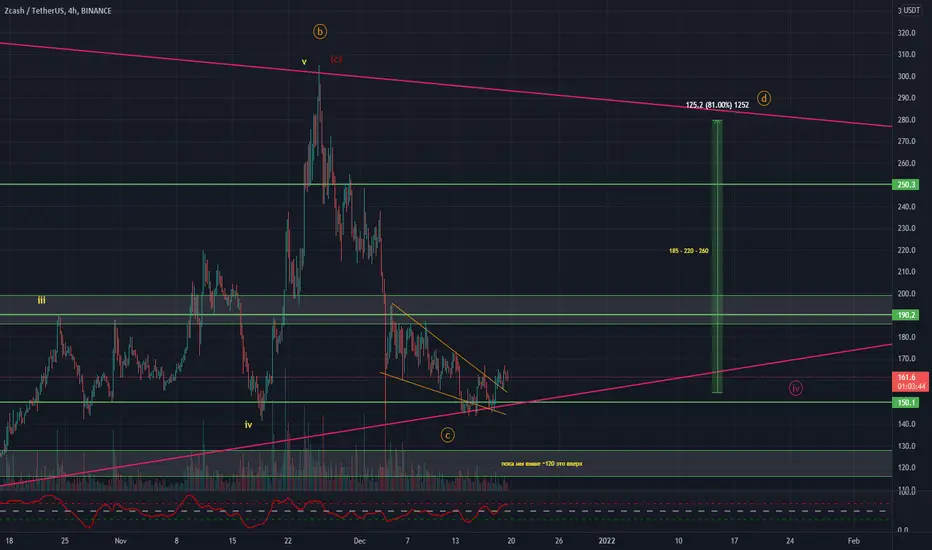
Everything on the chart.
open pos: market and lower
target: 185 - 220 - 260
after first target reached move ur stop to breakeven
stop: im w/o stop (depending of ur risk). ALWAYS follow ur RM .
risk is justified
Good luck everyone!
Follow me on TRADINGView, if you don't want to miss my next analysis or signals.
It's not financial advice.
Dont Forget, always make your own research before to trade my ideas!
ZECUSDT is creating a descending channelZECUSDT is creating a descending channel on the weekly support.
IF the price is going to have a breakdown, According to Plancton's strategy (check our Academy ), we can set a nice order
–––––
Follow the Shrimp 🦐
Keep in mind.
🟣 Purple structure -> Monthly structure.
🔴 Red structure -> Weekly structure.
🔵 Blue structure -> Daily structure.
🟡 Yellow structure -> 4h structure.
⚫️ Black structure -> <4h structure.


spot & hold ZECevery time such as a crocodile buy cheep
and hold.
now our strategy in 2022 is SPOT.
we buy ZEC/USDT for 30% profit


ZECUSDT Triangle formation!ZECUSDT (1H Chart) Technical analysis update
ZEC/USDT currently trading at $153.9
zec forming symmetric triangle in 1h chart, if triangle breakout we can expect up move in zec.
Buy level: Above 154.5 (only buy after symmetric triangle breakout
TP 1: $158
TP 2: $163
TP 3: $170
TP 4: $180
Stop loss:$146
Max Leverage: 2x


ZECUSDTCame out of a downtrend forming a rounded bottom and recently broke a strong horizontal resistance at $148 level. Expected a move to the upside.

ZECUSDT is ready to MOVE UP !💎 ZECUSDT / 4H 💎
we have a Good Support zone in 4H time Frame , also we have Good news on RSI indicator !
we can see a possible bounce from here !


Trading Series: $ZECWho doesn't love security? Great entry rn at 153. Bullish AF on this gem! DCA more at 93, TP1 204, TP2 252, TP3 331.
NFA, DYOR.

Zec/Usdt i will talk to you in chart
you can see target and stop loss . R/R IS 1/9 ! Its awesome in spot
if you want use leverage take care !

Zecusdt 1dIt is my personal opinion
Good for swinging
This currency no longer has the ability to break the previous ceiling

ZEC usdtwe are now on an important support area.by maintaining the above range ,we can expect growth up to the black D range in the first stage ,otherwise the situation will be different.

Zec opportunity!!!Zec has broken its down trend channel and did a Pullback to it...in good condition of market we can see a good rising of zec but now it will be risky to enter in this position because of bitcoin's condition....

Patience for ZEC pump1) Resistance is breakout
2) Pullback in resistance that is a new support
Warning: That is not a buy or sell offer, It is just an idea and has an educational aspect!

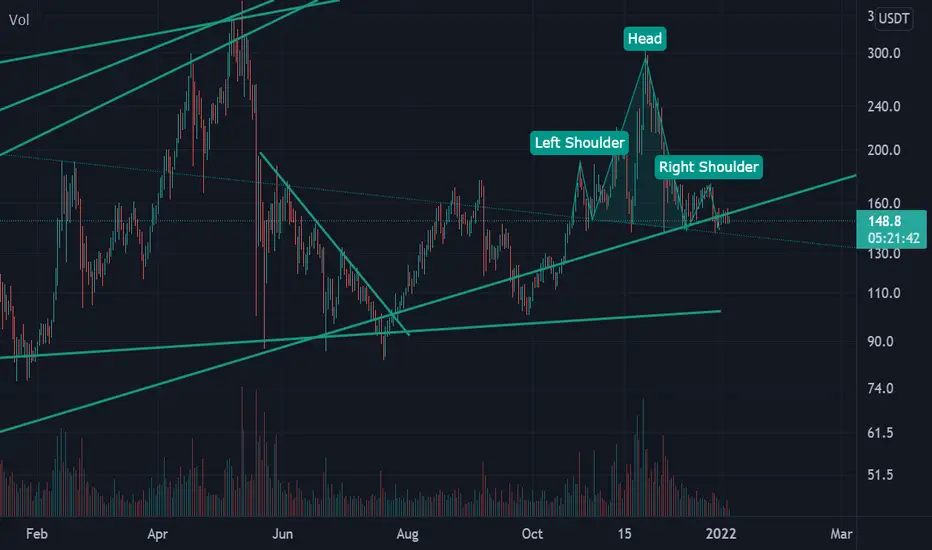
🔥Zcash short signal#ZEC/USD
🔥Zcash short signal, we hit the resistance zone, now we are falling down.
Subscribe to the channel, fresh signals every day! ✅✅✅

#ZECUSDT (Watchlist) 10/21#ZEC maybe worth it to add this coin to your Watchlist. 👀
Pree "like button" and leaving your "comments" below our ideas is a great thing and supports us to providing more ideas.❤️ (Share it with your folks)
Everything mentioned on the chart (Pattern/Resistance/Support / Breakout/Breadkwon levels, Also R: R)
add to watchlist means the coin we mentioned is forming a pattern or moving near a historical bottom, around or above good support, increase in trading volume , showing a reversal candle, accumulation stage, etc, but no reaction from bulls, so we inform you to add it to your watchlist until the right time for entry.!!
Ps:
we avoid trading any coin if the entire project for it is based on gambling, prostitution, human trafficking, borrowing, and lending, etc.
This is not financial advice, The purpose of these Charts is to give you an idea about coin movement (not buy or sell signal) so before following any idea be sure to do your own research, and follow your risk management. the Cryptocurrency market is very volatile and involves gains and losses as well so know very well what you are heading towards before engaging in it.
The information we mentioned here is a personal effort that is subject to success or failure and we welcome constructive criticism.
Good luck to All.
🙏we ask Allah reconcile and repay🙏

zecusdtHello dear traders, this image is a volumetric thermal map and shows you large purchase or sale orders so that you can find the route more easily in the short and long term.
Here are 150 good price
Be successful and profitable
