Long ZecusdtEntered leverged DCA long here with tight stoploss.
Risky entry but high RR.
Entered under 36 with flat and tight Sl at 35.
Rejection here can send it higher and slightly higher can trigger high TF long scenario.
Can hold for swing if pumped from here.
Note: Not a Financial Advise.
ZECUSDT trade ideas


The key is whether it can rise to around 44.80
Hello, traders.
If you "Follow", you can always get new information quickly.
Please click "Boost" as well.
Have a nice day today.
-------------------------------------
(ZECUSDT 1M chart)
-
(1D chart)
Since the M-Signal indicators on the 1D, 1W, and 1M charts are converging, the key is whether it can rise to around 44.80-49.89 and maintain the price.
If it fails to rise, the support around 27.89-33.18 is important.
If the price continues to rise, the HA-High indicator on the 1M chart is formed at 115.72, so it is expected that a full-scale uptrend will begin only when it rises above this point.
If the HA-High indicator on the 1M chart is newly created according to the price movement, it is important to see whether there is support near that point.
Based on the current price position,
1st: 44.80-49.89
2nd: 70.62-48.91
I think that the 1st and 2nd areas above are likely to be resistance zones.
However, if it receives support in this area, it is likely to show a sharp rise.
-
Accordingly, I think that the time to buy is when the M-Signal indicator on the 1D, 1W, and 1M charts rises above this point and shows support.
-
Thank you for reading to the end.
I hope you have a successful transaction.
--------------------------------------------------
- Big picture
I used TradingView's INDEX chart to check the entire range of BTC.
(BTCUSD 12M chart)
Looking at the big picture, it seems to have been maintaining an upward trend following a pattern since 2015.
In other words, it is a pattern that maintains a 3-year upward trend and faces a 1-year downward trend.
Accordingly, the upward trend is expected to continue until 2025.
-
(LOG chart)
Looking at the LOG chart, you can see that the upward trend is decreasing.
Accordingly, the 46K-48K range is expected to be a very important support and resistance range from a long-term perspective.
Therefore, I expect that we will not see prices below 44K-48K in the future.
-
The Fibonacci ratio on the left is the Fibonacci ratio of the uptrend that started in 2015.
That is, the Fibonacci ratio of the first wave of the uptrend.
The Fibonacci ratio on the right is the Fibonacci ratio of the uptrend that started in 2019.
Therefore, this Fibonacci ratio is expected to be used until 2026.
-
No matter what anyone says, the chart has already been created and is already moving.
It is up to you how to view and respond to it.
Since there is no support or resistance point when the ATH is updated, the Fibonacci ratio can be appropriately utilized.
However, although the Fibonacci ratio is useful for chart analysis, it is ambiguous to use it as a support and resistance role.
The reason is that the user must directly select the important selection points required to create the Fibonacci.
Therefore, it can be useful for chart analysis because it is expressed differently depending on how the user specifies the selection point, but it can be seen as ambiguous for use in trading strategies.
1st: 44234.54
2nd: 61383.23
3rd: 89126.41
101875.70-106275.10 (when overshooting)
4th: 134018.28
151166.97-157451.83 (when overshooting)
5th: 178910.15
-----------------

Zcash Continues Bullish: The Bottom Is In, Higher Prices ForeverNotice how Zcash continues bullish and moving within a rising channel. For this pair also, 3-Feb. means the correction/market low. This is always quite revealing because the Cryptocurrency market is one; what one does, the rest follows.
ZECUSDT has been producing higher highs and higher lows since July 2024, more than 8 months now.
The flush earlier this months is confirmed a flush because of the long wick on the 3-Feb. session candle. The lower wick is very long as the market was activating all the stop-loss orders that are set on the exchanges. This is why I recommend using a manual stop-loss. If you used a manual stop-loss, this move would result in no loss and the market recovers the next day. If you set a limit order as your stop-loss, you are simply telling the exchanges and the bots that you are committed to sell at a low price, and that's exactly what you get.
It is better to buy and hold focusing on the long-term.
Cryptocurrency is new.
Cryptocurrency is bullish.
Cryptocurrency is young.
With a new, bullish and young market, the best strategy is to buy and hold.
Cryptocurrency is the Internet 2.0.
We are only getting started and we will definitely change the world; for the better.
Thanks a lot for your continued support.
Namaste.

ZECUSDT 1WZEC ~ 1W Analysis
#ZEC So far it still maintains its bullish structure. Buy from here if you still have a Conviction on this coin with a minimum target of 20%+.

Zcash (ZEC) Breakout: Sky’s the Limit!Zcash (ZEC) has successfully broken above key resistance, confirming bullish momentum. With the breakout in play, the next target zone sits around $41.50. Now that resistance is shattered, ZEC is primed for a powerful surge with little standing in its way.

Zcash Ready, Will Hit A New ATH In 2025!Zcash has been absolutely awesome lately and this chart tells us that the best is yet to come.
Between July and December 2024 there is present on the chart a ~400% bullish wave. This is great. But, if prices were at the high of this wave it would feel uncomfortable to enter this market, to buy-in.
Guess what? Good news!
The flush earlier this month erased all gains from the previous bullish wave. This means that a new buy opportunity is present. We have great entry prices available for long-term gains.
The long-term gains is the 2025 bull-market.
Now, look at the chart.
The early 2025 February flus produced a new All-Time Low. This is a buy opportunity.
The wick low reversed at the same level as back in July 2024. This same level of the 2020 March flush. After the 2020 March flush, ZECUSDT grew by an astonishing 2,100%.
This is what I mean. Now that the flush is over, we are approaching a major bullish wave.
Even if some major exchanges remove this pair, this will do nothing to Zcash other than some temporary crash. Maybe.
Cryptocurrency is unstoppable and set to forever now grow. Today, yesterday and tomorrow. Tomorrow now, forever more.
Based on candle close we have higher highs and higher lows. Notice the blue lines on the chart.
We are due a new All-Time High in 2025.
Total growth potential from bottom to top can vary between 2,500% and 6,000%. I know, it is a wide range but the market is unpredictable when it comes to the exact top numbers, what can be predicted easily, is the upcoming bullish wave.
The market will grow.
Do you agree?
If yes, make sure to follow.
If no, continue reading and soon your idea will be the same.
If you don't agree by next month, the numbers will change your mind.
This is not speculation, I am telling you the future now, before it happens.
Cryptocurrency will grow.
The Altcoins will grow.
Bitcoin is going up.
This market force is unstoppable.
We are going up. The new finance is going up.
Thanks a lot for your continued support.
Namaste.

#ZEC–Bullish Reversal in Play? | Harmonic Pattern and DivergenceDowntrend Reversal in Sight?
#ZEC has been in a consistent downtrend and is currently at its lowest point. But the charts are telling a different story now.
Key Technical Highlights:
Harmonic Pattern: A clear Bullish Bat pattern has formed on the 1-day timeframe, signaling potential for reversal.
Bullish Divergence: We’re seeing a subtle bullish divergence, adding weight to the case for a potential trend reversal.
Resistance Break: The key confirmation level lies at 45.85. A break above this level will be our primary signal to go long.
What Does This Mean?
The technical indicators are aligning for a potential upward shift, but patience is key. We’ll need to wait for the resistance to break before entering the trade.
Once confirmed, we’ll be looking for a bullish entry at 45.85 with careful risk management in place.
Join the Discussion!
What’s your take on #ZEC? Are you seeing the same potential reversal, or is it too early to call?
Have you traded harmonic patterns before? Share your experiences below!

ZECUSDT 1D#ZEC is moving inside a falling wedge on the daily chart. It is on the verge of breaking out above the pattern resistance and the middle line of the Bollinger Bands. In case of a breakout, the targets are:
🎯 $45.42
🎯 $51.91
🎯 $58.39
🎯 $67.61
🎯 $79.37

ZCash can pump 600% from hereZcash is a decentralized cryptocurrency focused on privacy and anonymity. It uses the zk-SNARK zero-knowledge proof technology that allows nodes on the network to verify transactions without revealing any sensitive information about those transactions.
Contrary to a common misunderstanding, the majority of cryptocurrencies on the market, including Bitcoin (BTC), are not anonymous, but rather pseudonymous; while they do not explicitly reveal the identities of their users, each user has their own public address or addresses which can be traced back to them via the methods of data science and blockchain forensics.

ZECAnalysis is simple when you know how a project works and with ZEC i think that by tomorrow we will know for sure when markets opens where it will lead.
i think that after the price decline things will go as visualized, hope to get real by tomorrow.
nfa
dyor

ZECUSDT 1WZEC ~ 1W Analysis
#ZEC This is the lowest support for now. Buy gradually from here if you still have a Conviction on this Coin with a minimum target of 20%+

Told ya!BINANCE:ZECUSDT
it reached the second support I told you about!
⚠️ Disclaimer:
This is not financial advice. Always manage your risks and trade responsibly.
👉 Follow me for daily updates,
💬 Comment and like to share your thoughts,
📌 And check the link in my bio for even more resources!
Let’s navigate the markets together—join the journey today! 💹✨

ZEC Back to Inside RangeZEC is low volume coin because in privacy
This coin like create invalidation in $40 and back to range in $45
If we holding this support and break $51, most likely we will see $78 in mid timeframe

#ZECUSDT #1h (ByBit) Falling broadening wedge breakoutZcash regained 50MA support and broke out bullish on hourly, looks good for short-term recovery towards 200MA resistance and more.
⚡️⚡️ #ZEC/USDT ⚡️⚡️
Exchanges: ByBit USDT
Signal Type: Regular (Long)
Leverage: Isolated (10.0X)
Amount: 4.8%
Current Price:
49.41
Entry Targets:
1) 48.62
Take-Profit Targets:
1) 52.63
Stop Targets:
1) 46.61
Published By: @Zblaba
$CRYPTO:ZEC BYBIT:ZECUSDT.P #Zcash #Privacy z.cash
Risk/Reward= 1:2.0
Expected Profit= +82.5%
Possible Loss= -41.3%
Estimated Gaintime= 2-3 days


Zcash 2025 , the after Trump Pump analysis.Zkp is a new cryptographic technique implement first by the engineers of Zcash, a decentralized network. Details at z.cash .
Coming back for 40. Triple support there. Tight stops as always .

ZEC USDT💰 #ZEC (Zcash)
Zcash is showing a falling wedge pattern, a classic bullish reversal signal. With the price testing the lower boundary and bouncing, the breakout could be imminent 🚀.
Price Targets:
🎯 Target 1: $72.43
🎯 Target 2: $87.55
🎯 Target 3: $102.78
A confirmed breakout above the wedge could initiate a strong rally toward these targets 🔥.

ZEC 2D HarmonicSaving for reference later. SEED_DONKEYDAN_MARKET_CAP:ZEC harmonic. I am just learning harmonics and testing my work here. Please find the spirals as guiding points for price. Overall bullish.

I'm bearish on ZcashBINANCE:ZECUSDT
you can see that Zcash has created a bearish pattern.
the double top is pretty visible on the chart and I expect a break out soon. so yeah the price shall decrease soon.
The supports are shown on the chart.
⚠️ Disclaimer:
This is not financial advice. Always manage your risks and trade responsibly.
👉 Follow me for daily updates,
💬 Comment and like to share your thoughts,
📌 And check the link in my bio for even more resources!
Let’s navigate the markets together—join the journey today! 💹✨

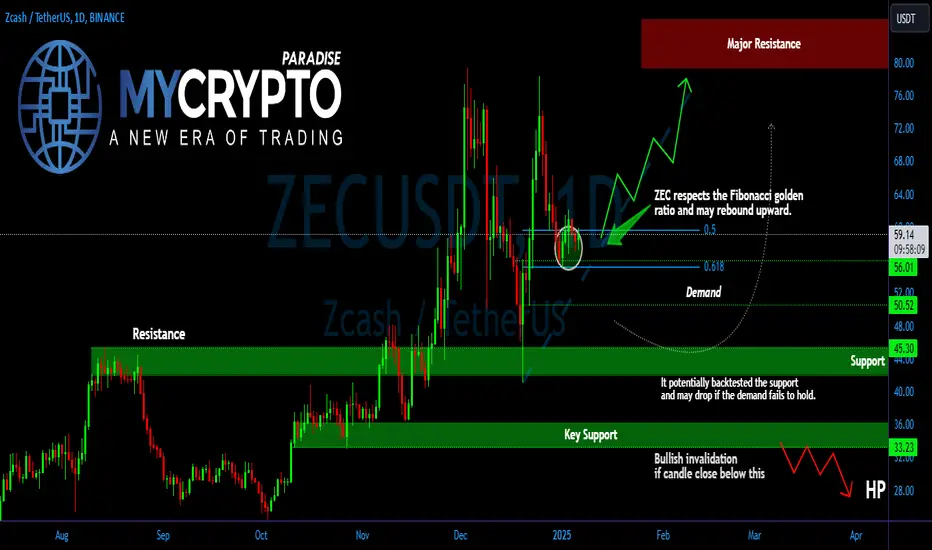
ZECUSDT: Is the Rebound Real, or Are We Heading Lower? Key LevelYello, Paradisers! Are we witnessing a genuine rebound for #ZECUSDT, or could this move be a trap before a deeper correction? Let’s take a closer look at what’s happening and the critical levels you should have on your radar.
💎#ZEC has shown respect for the golden ratio of the Fibonacci retracement, suggesting a potential bounce to the upside. However, the key question is whether the price can sustain above the crucial demand zone between $56 and $50.20. If ZEC holds this level, the upward momentum could continue, with the next target being a retest of the strong resistance area.
💎But what happens if ZEC fails to hold above this demand zone? In that case, the price could drop back to the $45.30 support area, a level that has historically triggered significant rebounds. This zone has acted as a strong base in the past, and it’s likely that any dip toward this level could see buyers stepping in once again.
💎The risk increases if ZEC breaks below this support and closes below $33.20. If this happens, we could see a much deeper correction, potentially pushing the price even lower. A candle close below this level would invalidate the bullish outlook and indicate further downside ahead.
Stay disciplined, Paradisers. Consistency in trading comes from managing risk and staying patient.
MyCryptoParadise
iFeel the success🌴
Trading opportunity for ZECUSDTBased on technical factors there is a Buy position in :
📊 ZECUSDT
🔵 Buy Now
🪫Stop loss 57.20
🔋Target 63.00
📏 R/R 2
💸RISK : 1%
We hope it is profitable for you ❤️
Please support our activity with your likes👍 and comments📝

ZEC UpdateZEC Update
We had good buying points between the beginning of 2024, the first month and the fifth month approximately, and its price was $ 16 in the last crypto shock when the markets fell violently
And in the last period, it achieved a 5-fold increase in the previous price in the past months
But the rise has not ended, so we can monitor this currency because it has other goals that exceed the previous goals. If your goal is investment, do not worry about any decline, because any decline is a buying opportunity and patience for future goals
