zecusdtHi friends, I was on vacation for two weeks and I was less present
But I'm back again
According to previous analysis, we have broken the supply level on a weekly basis
If the candle closes in the same way, we will have a slight fall and re-growth in the price chart.
ZECUSDT trade ideas

Zcash shortZcash broke trough the ascending trendline. Asset broke trough the support level. Bearish movement to support level at 100 is possible.

Zcash ZEC short Price Targets and Stop LossZEC/USDT short
Entry Range: $139 - 149
Price Target 1: $135
Price Target 2: $130
Price Target 3: $119
Stop Loss: $167


ZEC/USDT Scalp Trade Setup for Short Term#ZEC/USDT Scalp Trade :-
Breakout = ✅
Retest = ✅
- After Breakout of 200EMA Resistance,
Price is trading above 200EMA.
Which indicates Bullishness.
Entry :- $161-$168
Stop loss :- $155.90
Target :-
T1 :- $180
T2 :- $195
TP3:- $210

ZEC - LONG ITHey Guys, sorry, I forgot to post this one. I wrote in my last ZEC post it could be a perfect long or short. I opened a long trade and put in more money now.
No financial advice!
DOYR!
Happy Trading


ZECUSDT_1D_LONGIdea is to take long position since ZECUSDT is being dominated by the bulls over multiple fronts. 3 Trade plans have been mentioned, 2 for long and 1 for short

ZCASHUSDT - SETUP - hello crypto lovers
- ahmed signals team wishes you high profits
------------------ ZCASH USDT ----------------------
_ buy : 180
| TP 1 : 184
| TP 2 : 189

ZECUSDT SETUPZECUSDT price is trying to bounce after breaking the falling channel and now bulls are trying to push the price towards upside resistance.


ZECUSDT(170,173) is stronge support zone and look like ZECbreaked it ,if we get signal bar and key bar ZEC can be move to next target
ZECUSDT - Bullish Breakout ZEC breaking out nicely on the fib level, but it’s might be just B wave correction. So, secure some of your position at fib 61.8 and enjoy profit run.

ZEC long $ZEC is bouncing off the support level and the bullish trendline. Bullish movement to resistance level at 213$ is likely to happen.

zecusdtContinuation of the previous analysis
We are witnessing a divergence that is likely to break out of the downtrend sooner

zecusdtHello friends, according to the previous analysis, we approached the entry point
So we will have an arrival signal today or tomorrow
**If this analysis was useful to you, please like it**

zecusdtHello friends
This analysis is also related to one-hour time, where everything is clearly visible in the chart

ZEC - SHORTHey Guys, a quick one. I think ZEC will break the trendline and that could be a big short! No financial advice! DYOR!!!
Happy Trading!

#ZEC190$ strong resistance line. 125$ is a strong support line.
The $160 level is a local support line.

ZEC/USDTwill take the deal from this lvl stop lose and target as showen
make sure to put SL
good luck

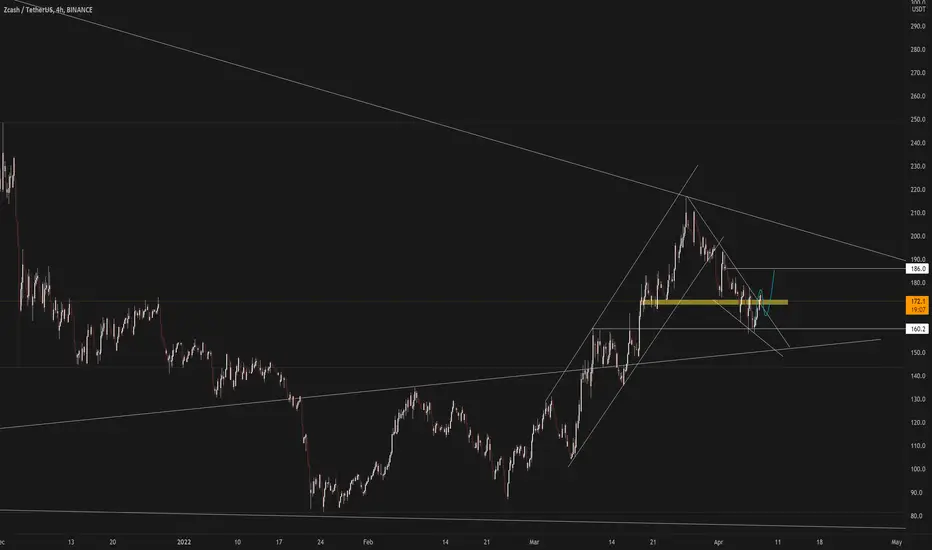
Not quite bullish, ZcashZcash has formed a descending triangle here, as you can see. It will probably retest 172 - 173 before continuing to drop further, possibly to 154 ? A/D shows that Zcash has not been accumulated, nor distributed, so the chance of being dumped is quite high, so don't miss this great drop.

ZECUSDT BULLISHThere is a RSI divergence and the pair has stayed above support and is creating a bullish trend.

ZECwhat i see on ZEC is about to move up hard we just need to break out the trend line and .. on the other side if we lose the yellow box support on weekly close it may fall to 90
