ZENBTCI believe ZENBTC can make a Gartly harmonic pattern in weekly time frame. MACD is also getting positive.
In daily time frame it could break MA200 validly.
ZENBTC trade ideas


ZEN/BTC (Testing Key Resistance Top)ZEN/BTC
-Horizen is currently trying to retest the recent top at 10k sat
-It is crucial to buy at current market price
-Because we don't know if ZEN can break this resistance area
-I recommend waiting for the breakout confirmation
-That will give us a strong bias that the uptrend is valid
-You can either enter on breakout or retest (pullback)
-Upside scenario is up to 14k sat to 19k sat range


HORIZEN +200% EOY"never bet against a coin barry silbert puts his reputation on the line for"
easy 200%+ by EOY, humbly.

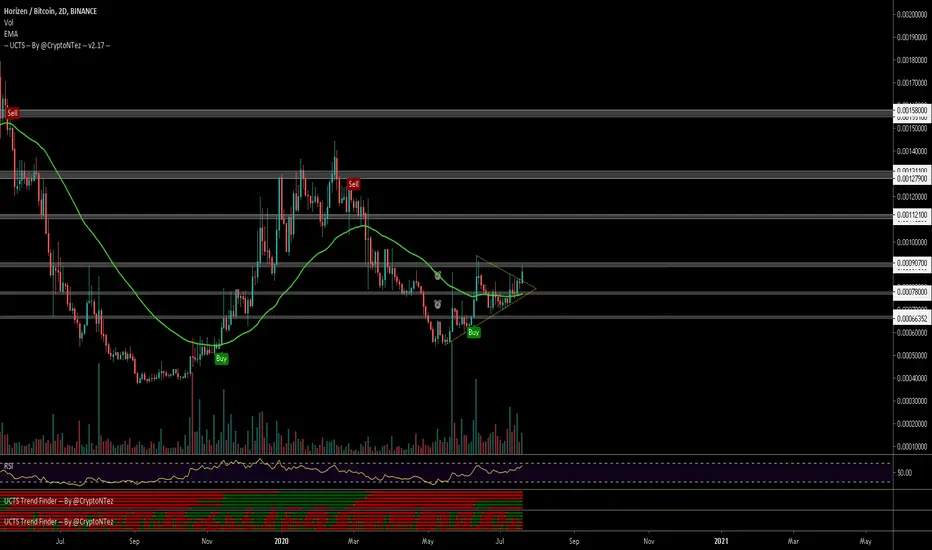
$ZEN, Retesting ~90k sats level...$ZEN
Retesting ~90k sats level as its trying to break from Symmetrical Triangle w/ UCTS Buy signal active on the 2D..
Waiting for a potential R/S flip at this level as sign of continuation toward ~112k sats or higher...
#ZEN


The "W" Pattern ExplainedThis pattern is very common when looking at the altcoins trading pairs (cryptocurrency).
It looks like a "W" and works only when a higher low is present.
The "W" Pattern Explained
As prices drop and a low is hit, we get the first push up, followed by a drop that ends it in a higher low which signals that the pattern is complete.
After the second push, we get a final retrace before prices resume up.
Note: Even if you spot this pattern, you still need a plan/strategy before you trade.
You need to have a stop-loss, in case the prices drop and a target to secure/collect profits if the pattern plays.
This is Alan Masters.
Thanks a lot for your continued support.
Namaste.


ZEN/BTC (Weekly IH&S Pattern?)ZEN/BTC
-looking at the weekly chart
-this may be forming a bullish Inverse H&S pattern
-the confirmation of this pattern is the break of neckline resistance
-if this reversal setup will play out
-most likely aggressive long term buyers are already scaling in the RS
-while breakout traders are awaiting the neckline break confirmation
-well, this is a long shot and a lot of things may still happen in the mid


Another ascending triangle forming at ZEN/BTC (LONG)There is another ascending triangle forming at ZEN/BTC so its a safe bet at this price level.
Let me know if you've got feedback! Always eager to learn!
Thank you.

Horizen Potential 100%+Accumulation cylinder is forming.
TP1: 13.5-14k sats
TP2: 17-18k sats
STOP: Close below 7k
The books are extremely thin as there are only 9 million ZEN in circulation so we just need a bit of volume to get the party started.
These are soft targets and it can go much higher if there's demand.
Trade at your own risk.


ZEN/BTC. Long Term AltcoinHey guys, I am waiting for 300+% for the next 2-3 months.
Entry zone: under 7650
I will set up 5 TP
20% - 0.001151
20% - 0.0015446
20% - 0.0020391
20% - 0.0028845
20% - 0.0036662


Trading With ColorsHello friends. This is simply a moving average ribbon, per se. The values for the colored ribbon can have their length calculated to fit their chosen resolution on the current one. This solved problems for me, but it was my own solution. Maybe I'll learn something new from sharing this.
To everybody else who is learning as well, this script essentially serves to introduce other time-frame moving averages. This intends to helps traders find the scope of relevance and not get lost in the current time-frame.
Besides the colored moving averages (2 sets, different resolutions, great zoomed in our out), I included optional check-boxes to allow comparison of sets of moving averages at will, so that the most important to the individual trader can be compared and selected specifically.
I kept the default options set to keep it clean. It likely won't be the only indicator on one's chart, so it's naturally best to reduce indicator noise from one, as to not subtract from the benefit of the other indicators.
I integrated tons of acquired knowledge into this, so I hope somebody finds a missing piece to their collection or a solution to a coding problem within. I also hope this provides a new insight and helps others on their path to financial freedom.
Best wishes.
PS: I left some old code in comments in case it helps to understand the evolution of my code. I'll update this once it works on the Daily. You might figure it out before I do, in wish case, do share :)
