ZEN Downtrend
The strong downside doesn´t seem to be over, and the wrapping up of the green abc correction should lead us to fresh new los under 9.88.
Red support could give us a correction to the upside on smaller timeframes, but I am considering this an opportunity for a short trade.
ZENUSDT trade ideas

ZEN/USDTKey Level Zone: 15.230 - 15.500
HMT v6 detected. The setup looks promising, supported by a previous upward/downward trend with increasing volume and momentum, presenting an excellent reward-to-risk opportunity.
HMT (High Momentum Trending):
HMT is based on trend, momentum, volume, and market structure across multiple timeframes. It highlights setups with strong potential for upward movement and higher rewards.
Whenever I spot a signal for my own trading, I’ll share it. Please note that conducting a comprehensive analysis on a single timeframe chart can be quite challenging and sometimes confusing. I appreciate your understanding of the effort involved.
Important Note :
Role of Key Levels:
- These zones are critical for analyzing price trends. If the key level zone holds, the price may continue trending in the expected direction. However, momentum may increase or decrease based on subsequent patterns.
- Breakouts: If the key level zone breaks, it signals a stop-out. For reversal traders, this presents an opportunity to consider switching direction, as the price often retests these zones, which may act as strong support-turned-resistance (or vice versa).
My Trading Rules
Risk Management
- Maximum risk per trade: 2.5%.
- Leverage: 5x.
Exit Strategy
Profit-Taking:
- Sell at least 70% on the 3rd wave up (LTF Wave 5).
- Typically, sell 50% during a high-volume spike.
- Adjust stop-loss to breakeven once the trade achieves a 1.5:1 reward-to-risk ratio.
- If the market shows signs of losing momentum or divergence, ill will exit at breakeven.
The market is highly dynamic and constantly changing. HMT signals and target profit (TP) levels are based on the current price and movement, but market conditions can shift instantly, so it is crucial to remain adaptable and follow the market's movement.
If you find this signal/analysis meaningful, kindly like and share it.
Thank you for your support~
Sharing this with love!
HMT v2.0:
- Major update to the Momentum indicator
- Reduced false signals from inaccurate momentum detection
- New screener with improved accuracy and fewer signals
HMT v3.0:
- Added liquidity factor to enhance trend continuation
- Improved potential for momentum-based plays
- Increased winning probability by reducing entries during peaks
HMT v3.1:
- Enhanced entry confirmation for improved reward-to-risk ratios
HMT v4.0:
- Incorporated buying and selling pressure in lower timeframes to enhance the probability of trending moves while optimizing entry timing and scaling
HMT v4.1:
- Enhanced take-profit (TP) target by incorporating market structure analysis
HMT v5 :
Date: 23/01/2025
- Refined wave analysis for trending conditions
- Incorporated lower timeframe (LTF) momentum to strengthen trend reliability
- Re-aligned and re-balanced entry conditions for improved accuracy
HMT v6 :
Date : 15/02/2025
- Integrated strong accumulation activity into in-depth wave analysis

BUY SPOT RENUSDT (Short-Term Strategy with Rainbow MG3 H1 - D1)🚀 BUY SPOT RENUSDT (Short-Term Strategy with Rainbow MG3 H1 - D1)
📢 RENUSDT is in a weekly downtrend, presenting a strategic spot buy opportunity for short-term gains.
📌 Trade Setup & Market Outlook
✔ While REN is in a weekly downtrend, it offers a tactical buy opportunity for a 30% strategy over the next few days.
✔ Can be combined with Rainbow MG3 indicator on H1 - D1 for signal confirmation.
📌 Trade Plan:
Trend: Buy spot.
Entry Point: $12 or around that level.
Target: $15 - $16.5.
Hold Time: This week (Short-term trade).
💡 Key Considerations:
✔ Use Rainbow MG3 indicator on H1 - D1 to refine entry signals.
✔ Monitor breakout confirmations for stronger momentum.
✔ Manage risk and take profits gradually near targets.
🔥 RENUSDT is setting up for a solid short-term trade – Stay alert for the right entry! 🚀

ZEN’s Reversal Zone – Perfect Time to Go Long?ZEN has seen a sharp 78.65% decline from its $46.28 high, dropping over the past 40 days. With six consecutive red daily candles, we’re at a critical point to determine whether a bullish reversal is near or if further downside is ahead. Let's analyse the key support and resistance zones and establish high-probability trade setups.
Support Levels & Confluences
1️⃣ Psychological Support – $10: Price bounced off $10, aligning with the 0.886 Fib retracement.
2️⃣ Trend-Based Fib Extension 0.786 – $11.33: Indicates potential correction completion
3️⃣ Yearly Open from 2021 – $11.61: Acts as a historical support level
4️⃣ Weekly Support at $11.48 (0.618 Fib Retracement): Aligns with the weekly order block ($12.13 - $11.45)
5️⃣ Monthly 21 SMA – $10.86: Aligns with the 0.786 Fib
Long Trade Setups – Laddering Strategy
Long positions can be laddered from $11.48 (0.618 Fib) down to $10.82 (0.786 Fib) for a better cost basis.
Long Entry #1: $11.48 (0.618 Fib Retracement)
Long Entry #2: $11.00 (Mid-range level between fibs)
Long Entry #3: $10.82 (0.786 Fib Retracement)
Stop Loss: Below $10.60
Take Profit: $14 - $15
R:R: 13:1 (for 0.786 Fib entry)
This laddering approach allows for better risk management and capital allocation.
Alternative Long Entry – Confirmation-Based Trade
Entry: If price reclaims $12.11 (Daily Open & Weekly Level) and retests it as support
Stop Loss: Below $11.48
Target: $14 - $15
R:R: 3:1
Resistance Levels & Short Setup
1️⃣ Weekly Open - $14.20
2️⃣ Monthly Level - $14.85
3️⃣ Weekly Level - $15.12
4️⃣ Key Resistance - $15
5️⃣ 0.5 Fib Retracement from Downward Wave - $15.25
6️⃣ Weekly 21 SMA - $14.92
Short Setup (If Price Reaches Resistance & Shows Weakness)
Entry: Between $14.85 - $15.25
Stop Loss: Above $15.50
Take Profit: $14.2 - wOpen
Key Takeaways:
Ladder long entries from $11.48 - $10.82 to maximise R:R
Alternative long trade if price confirms $12.11 as support
Strong resistance at $14.85 - $15.25, ideal for profit-taking or a short trade setup
Multiple confluences (Fib levels, moving averages, order blocks) confirm these setups
New Free Indicator Release 🚀
I've just launched a FREE TradingView indicator – Multi Timeframe 8x MA Support & Resistance Zones. It helps visualise key support and resistance levels across different timeframes. Check it out and let me know your thoughts!

ZEN Trend Successfully ChangedZEN Detailed Analysis on 4h tf.
ZEN has successfully changed it's trend from down to the upside and re testing it as well. Also it is holding well 200EMA daily + 50EMA 3D.
I am aiming the next leg up soon towards 26$ - 29$ (Fair Value Gap Area)
Hope for the best.
#nfa #dyor #aqeelonline

Anticipated ZEN Drop Hits Target – Long Now?The anticipated drop I was watching has played out, providing excellent long setups across many coins, including ZEN. ZEN retraced perfectly to the POC at $17.07, aligning with the fib retracement 0.85
This confluence makes it an ideal long setup, offering great potential gains
Long Entry: $17.3
Target 1: $21 (R:R 2.5)
Target 2: $27 (R:R 6)

Is ZENUSDT Ready for a Reversal or More Downside?
BINANCE:ZENUSDT is nearing a key support zone around 18.00, which has been a reaction level in the past. The EMA ribbon is bullish, and the Signal Builder has previously sent buy signals. The market structure remains bullish, as the price has broken above the last significant high.
A potential trade setup involves waiting for the price to test the 18.00 level. If the level holds, the next target is 39.00. However, if the price breaks below 18.00, the setup becomes invalid, and the 6.00 level could serve as a long-term accumulation area.
👨🏻💻💭 Do you think ZEN will hold the 18.00 level or drop further? Let’s discuss!
__________________________________________________________________
The information and publications within the 3Commas TradingView account are not meant to be and do not constitute financial, investment, trading, or other types of advice or recommendations supplied or endorsed by 3Commas and any of the parties acting on behalf of 3Commas, including its employees, contractors, ambassadors, etc.


ZENUSDT 1WZEN Update ~ 1W
#ZEN Retesting this support block,. If you still have Conviction on this coin,. buy back from here with a minimum target of 20%++

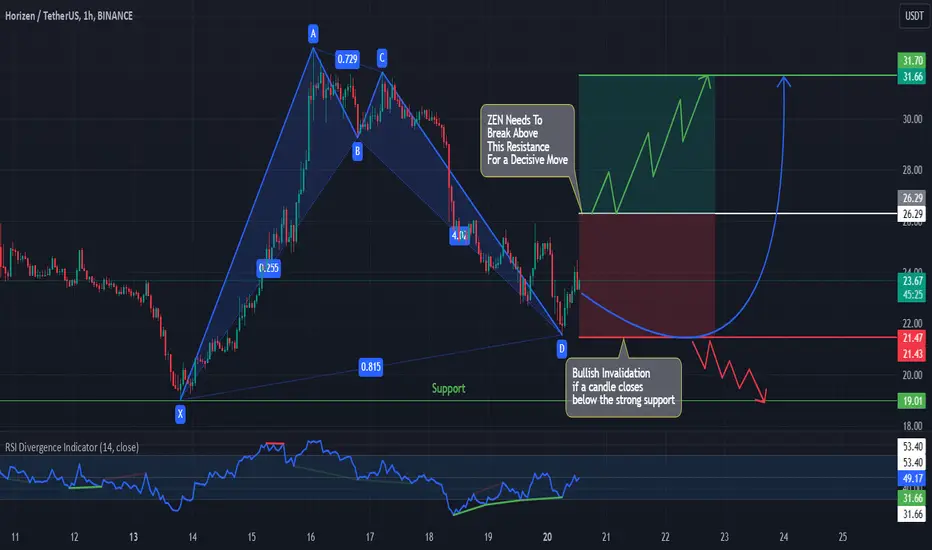
ZEN: Harmonic Pattern & Bullish Divergence on 1H ChartAnalysis Overview:
ZEN is currently in a downtrend but is forming a potential Harmonic Pattern on the 1-hour timeframe. This is accompanied by Bullish Divergence, which suggests a possible trend reversal to the upside.
For a confirmed bullish trend, we need a decisive breakout above the previous Lower Highs (LHs). Once this occurs, the price structure may shift, forming Higher Highs (HHs) and Higher Lows (HLs), reinforcing a bullish outlook.
Trading Plan:
Entry Trigger: Wait for a breakout above the previous LHs as confirmation.
Risk Management: Use a well-defined stop-loss level below the recent swing low to minimize risks.
Target: Gradually scale into the position as HHs and HLs form, aiming for key resistance levels.
Note: Always adhere to your trading plan and risk management rules. Wait for confirmation before entering a trade.
ZEN Trade Setup: Ride the Wave to +50% ProfitAfter a strong bullish impulse, ZEN completed a 5-wave structure resulting in a +72% price increase and successfully took out a key high. This marked a potential short trade opportunity at the key resistance level.
Subsequently, the price retraced significantly, forming a pullback into the golden pocket (0.618–0.65 Fibonacci retracement), a high-probability buying zone. This corrective move also completed a 5-wave structure to the downside, providing a favorable long trade opportunity with a compelling Risk-to-Reward (R:R) ratio of 3:1.
The target for this long trade is the 0.618 Fibonacci retracement level of the entire impulse wave at $35.86, representing a potential upside of nearly 50%. Additionally, the negative 0.234 Fibonacci level at $35.98 aligns closely with this target, creating a good confluence zone.
Key Levels:
Entry Zone: $23–$25
Primary Target: $35.86 (0.618 Fibonacci retracement)
Confluence Level: $35.98 (Negative 0.234 Fibonacci extension)
Stop-Loss: Below the low of $21 for downside risk mitigation, DCA

Horizen Elliot Wave is ConvincingAfter retesting 18 as resist become support, rapid bounce to 30 is indicating we have done corrective wave after breakout 25
I think we are heading last wave if not continuation normally it will hit around 52 and 64

Trading opportunity for ZENUSDTBased on technical factors there is a Sell position in :
📊 ZENUSDT
🔴 Sell Now
🪫Stop loss 32.90
🔋Target 23.40
📏 R/R 2
💸RISK : 1%
We hope it is profitable for you ❤️
Please support our activity with your likes👍 and comments📝

ZENUSDT: Two Blue Boxes, Two Opportunities!ZENUSDT: Two Blue Boxes, Two Opportunities! 🚀
ZENUSDT is presenting two crucial zones to watch:
First Blue Box: Perfect for a short-term upward move. A quick reaction here could bring solid gains for the nimble trader.
Second Blue Box: This is the big one! A visit here has the potential to spark new highs.
How to play this smart: Always confirm with CDV, volume profile, and lower time frame market structure breaks before jumping in.
Opportunities like this don’t wait. Be sharp, stay ready, and dominate the charts! Boost, comment, and follow for more insights. 💹
Let me tell you, this is something special. These insights, these setups—they’re not just good; they’re game-changers. I've spent years refining my approach, and the results speak for themselves. People are always asking, "How do you spot these opportunities?" It’s simple: experience, clarity, and a focus on high-probability moves.
Want to know how I use heatmaps, cumulative volume delta, and volume footprint techniques to find demand zones with precision? I’m happy to share—just send me a message. No cost, no catch. I believe in helping people make smarter decisions.
Here are some of my recent analyses. Each one highlights key opportunities:
🚀 GMTUSDT: %35 FAST REJECTION FROM THE RED BOX
🎯 ZENUSDT.P: Patience & Profitability | %230 Reaction from the Sniper Entry
🐶 DOGEUSDT.P: Next Move
🎨 RENDERUSDT.P: Opportunity of the Month
💎 ETHUSDT.P: Where to Retrace
🟢 BNBUSDT.P: Potential Surge
📊 BTC Dominance: Reaction Zone
🌊 WAVESUSDT.P: Demand Zone Potential
🟣 UNIUSDT.P: Long-Term Trade
🔵 XRPUSDT.P: Entry Zones
🔗 LINKUSDT.P: Follow The River
📈 BTCUSDT.P: Two Key Demand Zones
🟩 POLUSDT: Bullish Momentum
🌟 PENDLEUSDT.P: Where Opportunity Meets Precision
🔥 BTCUSDT.P: Liquidation of Highly Leveraged Longs
🌊 SOLUSDT.P: SOL's Dip - Your Opportunity
🐸 1000PEPEUSDT.P: Prime Bounce Zone Unlocked
🚀 ETHUSDT.P: Set to Explode - Don't Miss This Game Changer
🤖 IQUSDT: Smart Plan
⚡️ PONDUSDT: A Trade Not Taken Is Better Than a Losing One
💼 STMXUSDT: 2 Buying Areas
🐢 TURBOUSDT: Buy Zones and Buyer Presence
🌍 ICPUSDT.P: Massive Upside Potential | Check the Trade Update For Seeing Results
🟠 IDEXUSDT: Spot Buy Area | %26 Profit if You Trade with MSB
📌 USUALUSDT: Buyers Are Active + %70 Profit in Total
🌟 FORTHUSDT: Sniper Entry +%26 Reaction
🐳 QKCUSDT: Sniper Entry +%57 Reaction
📊 BTC.D: Retest of Key Area Highly Likely
This list? It’s just a small piece of what I’ve been working on. There’s so much more. Go check my profile, see the results for yourself. My goal is simple: provide value and help you win. If you’ve got questions, I’ve got answers. Let’s get to work!

ZENUSDT: Bearish Trend (AB=CD Pattern)ZEN is moving in down trend and currently its forming AB=CD Pattern on 1hr time frame, and also break the Support area. so we can take a short trade on CMP with proper risk management.

Is ZEN Preparing for a Bounce? Key Levels to WatchZEN recently broke down from a 10-day descending triangle, signaling bearish continuation with strong selling volume. This triangle forms the B wave of an ABC corrective pattern, indicating further downside is likely before any potential reversal. Let’s dive into the technical details and key levels to watch.
Key Observations and Levels:
1.) Descending Triangle Breakdown:
The measured move target of the descending triangle lies at $18.7, aligning perfectly with multiple confluences:
The 0.702 Fibonacci retracement from the recent lows.
The previous trading range highs, adding historical support to this level.
2.) Fair Value Gap (FVG):
Back in December, ZEN broke out of its previous trading range, leaving an unfilled FVG around $19.5, our previous high on December 7th, 2024.
This gap represents a significant area where price may return before resuming its trend.
3.) Support Zone – $20 to $18.7:
The $20 psychological level is a key point and aligns with our support trendline from previous lows.
The Fibonacci negative 1 extension of the descending triangle also targets $18.7, further reinforcing this level as a significant support.
4.) Trade Setup:
The $20–$18.7 zone presents a strong support area with multiple confluences, making it a favourable entry point for a long position.
However, confirmation is essential! Watch for bullish candle patterns and volume signals before entering.
Conclusion:
ZEN’s breakdown from the descending triangle suggests further downside, but the $20–$18.7 zone offers a robust support area with several technical alignments: Fibonacci retracements, the descending triangle target, historical range highs and an unfilled FVG.
This zone presents an attractive long opportunity, provided confirmation signals are present. Monitor the price action closely in this range to capitalise on a potential bounce.
Happy trading everyone!

ZENUSDT 12H#ZEN is moving inside a falling wedge pattern on the 12H chart. In case of a breakout, the targets are:
🎯 $29.67
🎯 $34.35
🎯 $38.14
🎯 $41.92
🎯 $47.30
🎯 $54.16

ZENUSDT 1WZEN Update ~ 1W
#ZEN So far it continues to maintain its bullish structure. This is wave 4 in the Eliot Wave pattern. Minimum target 20%++

ZEN Correction Analysis
After a beautiful pump, ZEN is now correcting, together with the whole crypto market.
We have already reached typical correction levels (50-61.8% pullback), so I'll be keeping an eye on reversal patterns for long trades.
There a support level in the green zone, around 18-19, which could serve as the platform for a new uptrend.

ZEN / USDT : On the verge of a breakout at Trendline resistance ZEN/USDT: On the Verge of a Breakout After Rejection at Resistance
ZEN/USDT is showing signs of a potential breakout 📈 after facing rejection at a key resistance level 📊. The pair has been testing the upper boundary, creating anticipation for a bullish rally 💥. A successful breakout could pave the way for significant upward momentum 🚀. Stay alert 👀 for confirmation to take advantage of this opportunity.
Key insights:
1. Resistance testing: ZEN/USDT has repeatedly tested the resistance zone but has not yet broken through. Continued pressure at this level increases the likelihood of a breakout soon.
2. Volume analysis: Watch for a volume surge during the breakout to confirm buyer dominance 🔥.
3. Positive momentum: Indicators like RSI and MACD are signaling building strength ⚡, supporting the possibility of a bullish move.
Steps to confirm the breakout:
Look for a decisive 4H or daily candle close above the resistance level 📍.
A noticeable increase in volume accompanying the breakout can confirm buying strength 📊.
A retest of the broken resistance as support will validate the move and reduce risks ✅.
Be cautious of false breakouts, such as sharp reversals or wicks above resistance ⚠️.
Risk management strategies:
Use tight stop-loss orders to protect your capital 🔒.
Position sizing should align with your overall risk management plan 🎯.
Avoid emotional trading and wait for confirmation before entering a position.
This analysis is for educational purposes only and not financial advice. Always conduct your own research (DYOR) 🔍 before making any investment decisions.

ZEN/USDT VOLUME INCREASEZEN/USDT VOLUME INCREASE
This coin shows a new volume start which can be confirmed.

Prepare to BUY Spot ZENUSDT
🌟 Capture the Momentum with ZENUSDT! 🌟
🌍 Market Overview:
ZENUSDT is presenting a strong opportunity for short-term gains, aligned with a bullish D1 timeframe.
📊 Trade Plan:
📌 Entry Point: Around $24 – Accumulate in this price range for a solid setup.
🎯 Target: +70% – Aiming for significant short-term returns.
⏳ Hold Time: Up to 1 week – Perfect for traders leveraging the D1 cycle.
💬 Reach out if you need additional strategy insights or personalized advice.
💡 Note: This is not financial advice. Always DYOR before trading.

Bearish Breakout: ZEN’s Path to $26 RevealedZEN has broken below both the daily open (dOpen) and weekly open (wOpen), signaling increased bearish momentum. The previous support levels now act as a Support/Resistance Zone, and bullish recovery requires reclaiming both dOpen and wOpen with significant volume. However, the current setup suggests further downside toward the $26–$25 range, which aligns with multiple confluences and the target from the Head & Shoulders (H&S) pattern.
Confluence for $26–$25 Support Zone:
Fibonacci Retracement (0.618): The key retracement level provides a strong support area.
$25 Key Level: A psychological and technical key level with historical significance.
Point of Control (POC): The POC from the previous trading range aligns perfectly with this zone.
Trend-Based Fibonacci Extension (1.272): The projected extension supports the target.
Fibonacci Speed Fan (0.777): Adds further confluence for this price level.
H&S Target: The projected target of the confirmed Head & Shoulders pattern coincides with this zone.
Outlook and Strategy:
Short-Term Bias: The bearish trend remains dominant unless bulls manage to reclaim dOpen and wOpen with strong volume.
Target Area: The $26–$25 range serves as the most probable area for a bounce or reversal due to multiple technical confluences.
Next Steps: If price reaches the support zone, look for a high-probability long setup with confirmation through increased buying volume, bullish candlestick patterns, and alignment with key indicators.
