ZEN/USDT Break out confirmed. Ready continue upward movement ?💎 Paradisers, #ZENUSDT has undoubtedly seized the market's attention. Presently, ZEN has made a successful breakthrough of a significant volume in the key supply area. This has led to ZEN entering a retesting phase in the demand area, which was formerly a supply area. While there's a possibility of ZEN returning to retest the demand area, any retracement is subject to market dynamics.
💎 However, if #ZEN manages to avoid revisiting the demand zone, it's well-positioned for continued upward momentum and could probability reach our target area.
💎 On the flip side, in the event that LSE:ZEN fails to rebound from the demand level during the retesting at $11, there's a risk of ZEN breaching the demand and descending to the lower demand area around $9. In such a scenario, it becomes critical for ZEN to stage a successful rebound from the $11 level if it intends to persevere in its upward trajectory.
💎 Should #Horizen experience a retracement to the lower demand area and fail to exhibit a rebound, it heightens the likelihood of breaching the demand area. Such an occurrence signifies a bearish turn in momentum and raises the prospect of ZEN continuing its descent, potentially revisiting the key support area.
ZENUSDT trade ideas

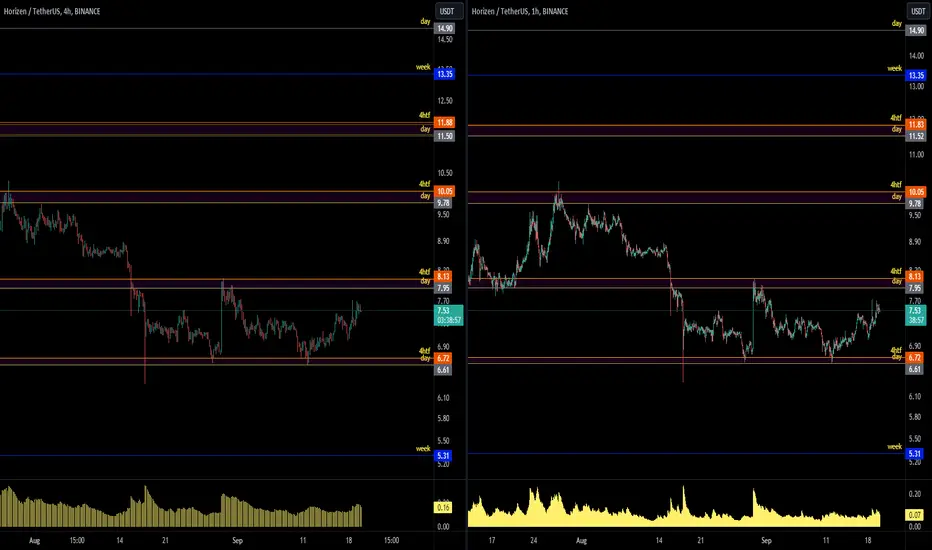
ZEN/USDT It is required break the resistance area to continue up💎 ZEN has certainly captured the market's attention with its notable rise. Recently, ZEN has achieved a breakout from the Ascending Channel pattern, surpassing the supply zone at the $8.57 mark. Currently, ZEN is experiencing consolidation within a significant resistance zone.
💎 For continued upward momentum, it's crucial for ZEN to breach this resistance zone; otherwise, it may retreat to the demand zone to gather additional strength for another upward push. A successful breakthrough at the $9.50 resistance level, with a candle close above it, would likely signal a sustained upward trend, the probability ZEN toward the projected supply zone target.
💎 Conversely, in a less favorable scenario, should ZEN return to the demand zone without demonstrating a bullish rejection or a bounce, it may indicate vulnerability at this level. A failure to hold the demand zone could lead to a re-entry into the Ascending Channel, suggesting a false breakout. This would likely initiate a bearish phase, with the potential for ZEN to regress towards the support zone.

ZEN/USDT Break Alert, Bullish Momentum ?? Horizen Analysis TodayYello Paradiserzs, Bullish Momentum for #ZEN
💎 ZEN has successfully broken out of the major falling wedge pattern, indicating a bullish momentum and a potential continuation of upward movement.
💎 Examining the price action prior to the breakout, ZEN has tested the demand area thrice. This area has consistently sustained ZEN, preventing further decline and reverting it back to the key support area. This led to a period of sideways movement for several weeks, which can be interpreted as an accumulation area. Now, ZEN has successfully navigated beyond the major constraints of the falling wedge pattern.
💎 Given the breakout from the pattern, there’s a potential for ZEN to establish a new higher high, considering the key support area previously marked the bottom for ZEN.
💎 However, this scenario would be invalidated if ZEN were to close below the key support on the weekly timeframe.

Horizen break the trend lineBINANCE:ZENUSDT Weekly chart horizen break the trendline and retest.Pls check the BINANCE:ETHBTC

ZEN BREAKOUT💥💥#ZEN Analysis : Breakout 💸💸
🔮#ZEN was testing a crucial key level at $8.00 and following a symmetrical triangle. Now we can see a perfect breakout here in #ZEN. It indicates the start of an upward trend. 💲💲
👀Current Price: $8.11
🚀 Target Price: $11.70
⚡️What to do ?
👀 There are some resistance at 9.60 and 11.73. Keep an eye on #ZEN price action and volume. We can trade according to the chart and make some profits. Stay tuned for further analysis and stay updated with market sentiments and news.⚡️⚡️
🏷Remember, the crypto market is dynamic in nature and changes rapidly, so always use stop loss and take proper knowledge before investments.
#ZEN #Cryptocurrency #Breakout #TechnicalAnalysis #DYOR

zenusdt-mentoringzenusdt
2-3 years of the project ( another scamborder project)
from technical perspective - tradebale
had its first cycle first runup then retrased almost to the launch price
curent situation - on weekly just a bit higher low ( if holds the low is in )
from here to the highs about 20x- not bad
look for short at 7.13
look for long above 8.13
look for long if retrace to 6.72
look for zombi if close under 6.61
$ZEN - The Next level is Coming UpBreak the diagonal line will be masive up.
Double bottom with Bullish Divergence

End of cicle ZENABC complete, from my prespective.
Manipulation on the orderblock. Waiting for the price to move up, W supply around 12usd.
NFA

ZENUSDTZENUSDT was trading in descending parallel channel and recently it seems like bulls are starting to take the charge and are about to breakout from descending channel with significant bullish divergence as well. Currently the price is forming a local support around 6.75 region.
Will the bulls take charge again continue for leg higher?

ZENUSDT - GOOD TIME TO BUYThe bias on this is strong on the psychological level.
The long the buy slowness go on, the better. This will confirm the selling pressure from the majority is not working.

$ZEN Performed Bullish peanutLSE:ZEN Performed Bullish peanut
What Is a Pennant?
In technical analysis, a pennant is a type of continuation pattern formed when there is a large movement in a security, known as the flagpole, followed by a consolidation period with converging trend lines—the pennant—followed by a breakout movement in the same direction as the initial large movement, which represents the second half of the flagpole.
Pennants are continuation patterns where a period of consolidation is followed by a breakout used in technical analysis.
It's important to look at the volume in a pennant—the period of consolidation should have lower volume and the breakouts should occur on higher volume.
Most traders use pennants in conjunction with other forms of technical analysis that act as confirmation.

If price continue SLOWLY moving up. Will go longNeed confirmation of 100% sell entry.
Without further sell pressure, price not gonna go low.

ZENUSDTZENUSDT is under strong sell pressure and break through important support zone with enormous sell pressure.
If the bears pressure is still on then bear's next target will be $8.
What you guys think of it ?

2 possible scenario for ZENthere is 2 possible scenario for ZEN that i explained on chart
in first scenario with that demand zone price create a new HL and can go up
second scenario will cause Change of character so be caution about it !!!
on second scenario this can keep going down or goin up

ZEN ANALYSIS (12H)Hi, dear traders. how are you ? Today we have a viewpoint to BUY/LONG the ZEN symbol.
For risk management, please don't forget stop loss and capital management
When we reach the first target, save some profit and then change the stop to entry
Comment if you have any questions
Thank You

Secure Tradefib 0.618 is always Strong for ZEN
1 HR unmitigated demand zone is set with fib 0.618
target to 4hr unmitigated supply

zen sellBINANCE:ZENUSDT L is are giving us good profit in sell position risk reward ratio is perfect, lets take it.

easy and simple Long positionfast and confirmed unmitigated15 min demand OB to another unmitigated 15 min supply

#ZEN/USDT - Long - Potentially 91.44%Direction: Long
Market: Spot
Risk: 0.25% - 1%
#USDT_ZEN
Exchange: BINANCE
Timeframe: 3D
TP1: 18.78
Entry: 9.88
STOP: 5.32
Zen 4.1 Mainnet dropping September lines up nicely with this year long falling wedge break. If we close this candle above the 200MA I'm confirming my position and holding to the 786 probably staggering some profit taking at the 0.5 also.
Big stop on this as BTC looking shaky, for this reason I'm going to stagger my entries with DCA buys at 8.06 & 6.88.

$ZEN,Testing Local highs... LSE:ZEN
Testing Local highs...
If manages to go for a breakout/flip around this area, we may see it going toward 11$ (20%+)
UCTS 2D Buy already on the chart
⏳

ZENUSDT → Exiting a bearish trend. Growth potential by 15.00BINANCE:ZENUSDT is forming a prolonged bearish wedge. Numerous resistance retests are inconclusive except for the last one. Against the backdrop of falling bitcoin, ZEN is showing strength.
The price after testing the bearish trend support consolidates and stops under the resistance at 9.66, forming an ascending triangle. Over the course of several weeks, price consolidates and continues to push up against resistance.
At the moment of volume surge, the price moves from the accumulation phase to the phase of realizing the potential. A breakout of resistance and a bullish impulse is formed.
A retest of the previously broken boundary or consolidation above 9.66 may be formed soon, which may give an opportunity to enter the market at a better price. It is also worth noting that the price is breaking the moving averages and this may indicate a trend change.
Support levels: 9.66, the previously broken trend boundary
Resistance levels: 11.4, 15.12
I expect the growth to continue after the breakout of 9.66. Medium-term outlook - strengthening to 15.12.
Regards R. Linda!

🔴 ZEN - 4H (23.07.2023)🔴 ZEN - 4H
Both EPs have been triggered to short ZEN from 9.304. Starting to look a bit over bought.
Full setup as follows:
EP 1 - 9.304
EP 2 - 9.490
SL - 9.759
TP 1 - 8.783
TP 2 - 8.528
TP 3 - 8.289

I Cannot Short This !!! situation+next targets.The ZENUSDT is in a Bullish phase by Ascending Triangle & Cup & Handle.
🌟Bullish signals are:
- Bullish Cup & Handle
- Dynamic Support zone
- Pivot weekly
- Ascending Triangle
⭐The pattern will increase the price as much as the measured price movement (AB=CD)
❗ Note if the Triangle or cup & handle is broken downwards with the strength of Bearish candles, this analysis of ours will be failed.
✅Thank you, and for more ideas, hit ❤️Like❤️ and 🌟Follow🌟!
