$ZIL, Crossed over ~64sats resistance level w/ increasing volume$ZIL
Crossed over ~64sats resistance level w/ increasing volume and now sitting over matching EMA50
UCTS Signaling a Buy signal on the daily & lower timeframes...
Looking for an entry at support level & looking for continuation toward ~76sats
#ZIL
ZILBTC trade ideas


ZILBTC 4H 60% upside strong chart(NEW)before we kick start the update. your upvotes/subs are appreciated.
Why get subbed to to me on Tradingview?
-15+ years real live trading experience
-TOP Author on TradingView
-professional chart break downs
-key levels
-no junk on my charts
-frequent updates
-covering FX/crypto/US stocks
-24/7 uptime so constant updates
So without further due. Keep it short/simple and to the point.
ZILBTC 4H 60% upside strong chart(NEW)
IMPORTANT: this is a speculative setup, performance
is not guaranteed, so please use a tight stop loss.
and always do your own due dill. thank you.
ZILBTC 4hour chart. Accumulation in progress,
chart looks bullish/strong, limited downside
from here. recommend market buying and holding
until TP. TP bulls is +60%.
This is BUY/HOLD setup. Hold time 2-8 days max.
I'm expecting everything to pump into BTC halving.
What happens later remains to be seen, let's focus
on one trade at a time for now.
get subbed to stay tuned for all the latest updates.
also add likes to support my efforts, thank you.
good luck traders!

This is only the start of an "Z"ourney to the Moon!This is one of the most powerful coins, strong and active project and i have reasons to believe this will go over ETH, it's just a younger coin, but much better in my opinion.
The coin is ready to give us one Moon shoot to 120+ short, but it's only the start. I expect 500+ until May
THIS IS NOT A FINANCIAL ADVICE, PLEASE INVEST AT YOUR OWN RISK


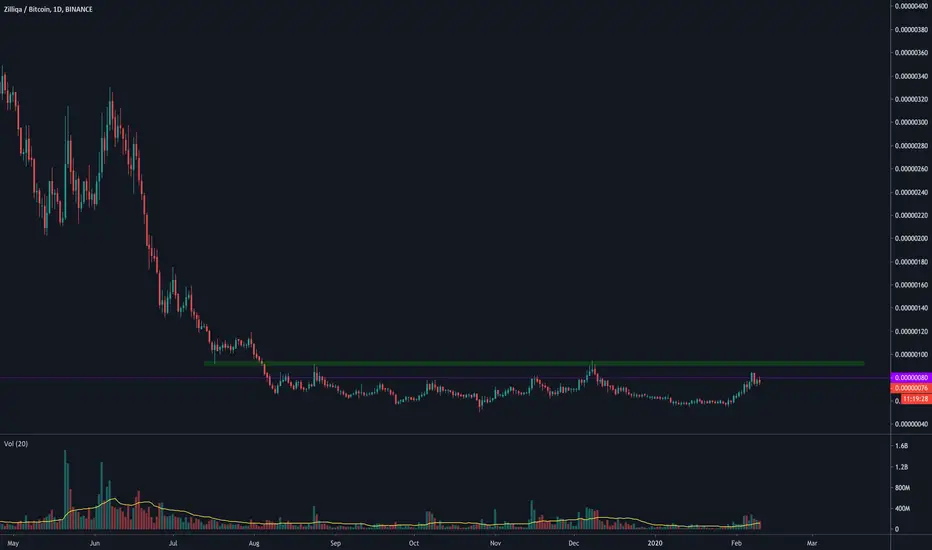
$ZIL Update - Almost 1 Year of Accumulation. Breakout soonHere we can see almost 1 year of extreme accumulation under 100 sats for ZIL. When the bull market comes I can see us breaking out and flying!

ZIL/BTC (Potential bottom?: up to 30% profit)ZIL/BTC
ZIL may have found the same support at 47 sats area which was also the previous consolidation area last Jan 2020 trading action.
If ZIL can break outside the downward trendline resistance, we could expect more upside scenarios up to the 80 sats region.
And place our stop-loss below 56 sats.

Buying a toilet paperSome wyckoff logic. Almost 1 year in consolidation. Jesus
USDT chart is better
If you are a developer, please, put those MDR indicators in tradingview.
vcdepth.io - check Gloval MDR - MaxTimeFrame. Compare it with BTC.D, Total2. You will find a pretty interesting correlation.
I will buy soon and I will try to ride swings with global MDR and btc.
Sounds like this coin have good fundamentals. Good or bad, who cares. maybe this programmer below will show something interesting.
www.youtube.com

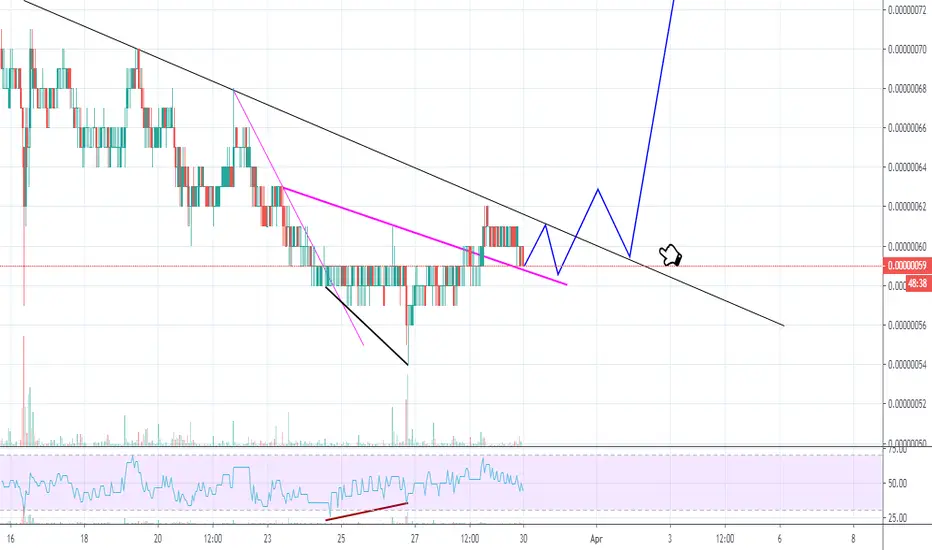
ZIL (Zilliqa) closer look: bullish Chuvashov fork to play outSo I'm going to speculate here a bit on hourly view for ZIL vs BTC to complement earlier ZIL chart on daily.
I expect this bullish C-fork to play out. Retest pink trendline once or twice, break main trendline and retest it, thus completing the fork.
Once main trendline is broken and IF we get a bounce there - I expect volume to start kicking in and that's where I'm buying.
Hourly close below 57 sats would invalidate C-fork setup.
ZIL / BTC DAILYZILLIQA, LOOKS ALSO READY, BUT, WILL I BREAKOUT? Divergence, Low volume longtime accumulation, need break red trendline

ZILBTC speculative setup 100%/150% gains (NEW)before we kick start the update. your upvotes/subs are appreciated.
Why get subbed to to me on Tradingview?
-15+ years real live trading experience
-TOP Author on TradingView
-professional chart break downs
-key levels
-no junk on my charts
-frequent updates
-covering FX/crypto/US stocks
-24/7 uptime so constant updates
So without further due. Keep it short/simple and to the point.
ZILBTC speculative setup 100%/150% gains (NEW)
IMPORTANT: this is a speculative setup.
results are not guaranteed.
please use a tight stop loss.
This is a great buy and hold setup for 100%/150% gains in ZILBTC.
Keep in mind. this is not a miracle/overnight casino gains
setups. will take time to hit TP, so only for patient
traders.
Currently under accumulation, looks like the low is set.
accumulating near lows with tight stop makes sense to me.
good luck traders.

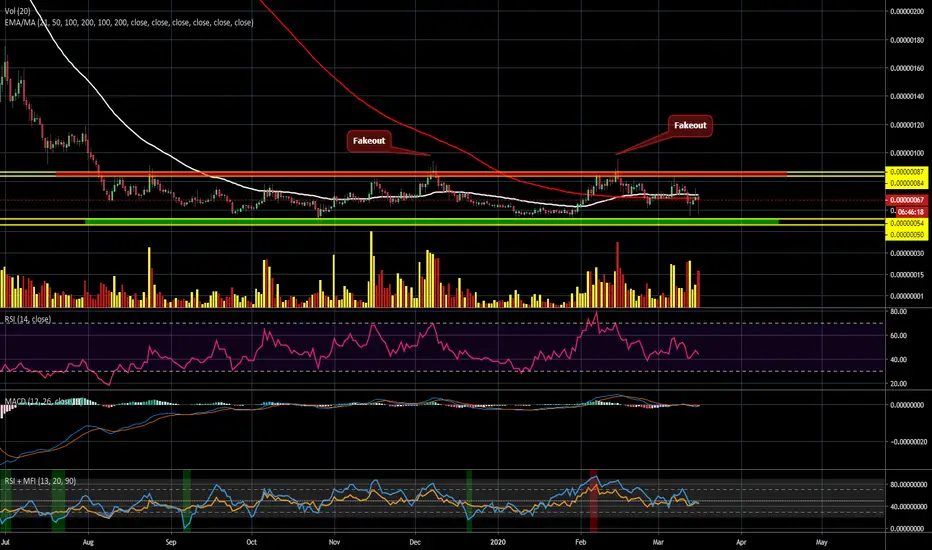
ZIL / BTC DAILY STRONG AND CONSTRUCTIVE PRICE BEHAVIOR! ZILLIQA:
* Long accumulation time! So that's good.
* Golden cross still in play!
* Volume is picking up!
* look at the swings in the channel, that's a big sign! Whale's are accumulating before breakout!
* If there will be a breakout out I expected a big volume breakout.
keep an eye on this one mates!
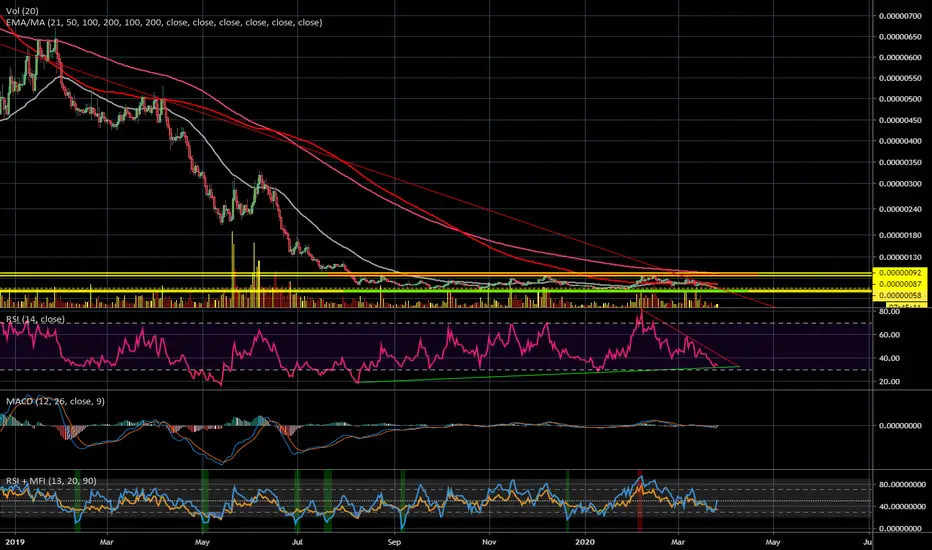
Zilliqa Challenges MA200, 75%+ Move MappedZILBTC (Zilliqa) has been printing a series of higher lows and bullish/green volume is now becoming predominant on this chart.
MA200 (black line) is being challenged as I write this.
This indicator right now is sitting at 68 satoshis (0.00000068), as soon as ZILBTC manages to conquer this resistance, we can see its price starting to move up.
Conditions for change
If prices drop and close below 60 satoshis (0.00000060), then we can say that the bullish momentum is gone. If we go below 0.00000055, the above signals become invalid and 0.00000050 becomes the next important support. Depending on how this level is handled, ZILBTC will move either down or up... We remain bullish and always expect a bounce even after a strong drop.
Thanks a lot for your continued support.
Namaste.


ZILBTC / ZILUSDTnothing much to add to the obvious. Find an entry you are comfortable with set a stop and watch. Huge upside with all the vacuum to the left. But remember, whatever btc does will dictate what alts are doing.
This sure looks promising, entered both pair USDT and BTC with little wider stops than usual. would start small and add along the way in case you aren't sold 100%

ZILBTC update go go , break this level ... mucho pumpo please
entered this with a small position just see if it were possible

Zilicious Potential InboundGetting this right requires markets to do what they do, and not much else.
Seriously though linda, risk becomes reward when things go according to their own nature.
Volatility is your friend sometimes.
This one should stay when others have to go. Going Long!
BNM

ZILBTCWell, relatively long sideways moves what look like accumulation ( only looks we never know ) , but if it can break the green levels we have a lot of vacuum to trade and maybe even a miracle bull run.
Not a pattern at all but tradable with smaller amounts.
Zilliqa is Next?If Bitcoin hovers around >10k next week and ZIL weekly closes above the marked resistance level 77 sats, we could see move quick movement like what happened to ICX.
I saw the comparison somewhere in twitter, just marking the levels for a trigger.

ZILBTCThe price crossed 100 EMA on the daytime timeframe and held on, it's a good sign. The recharge continued for quite some time and the momentum is likely to continue after 'this small correction up to 200 EMA. So this is a good chance to buy before further growth.
Stop: 65
Buy: 70-73
targets: 82, 90, 100

ZILBTCShort-term Bearish because of the high RSI and fallen volume.
Long-term Bullish because of higher lows and higher highs in current uptrend + above 50 EMA.
