ZILUSD trade ideas

$zil good time to accumulateWelcome to my analysis about zil, the price is consolidating for a while and I feel this is the right time to accumulate.


Zilliqa ideas using harmonics First publish. Ive been following price movement for a month or so. The last harmonic pattern played out well. Id like to see the following pattern break that expanding/ broadening wedge.

ZILLIQA DAILY CHARTS- In this chart we can see the possible options
of movement. We can see that the price can break the flag. If the price goes back, we could look for incorporation in the bearish divergence.
- The other option is that the price breaks down and we could look for support in the support marked as a rectangular area. This is a relevant volume area and it is possible that the price will return to it, which would be a great opportunity to buy if confirmation is given.

ZILLIQA WEEKLY CHARTSIn the weekly chart we see how a turning pattern marked by a semicircle has been formed. We see that the price breaks through the resistance area with a lot of volume and today the price is forming a bullish flag, indicating that a continuation pattern is likely. We see in more detail how we could take advantage of the movement in the daily chart.

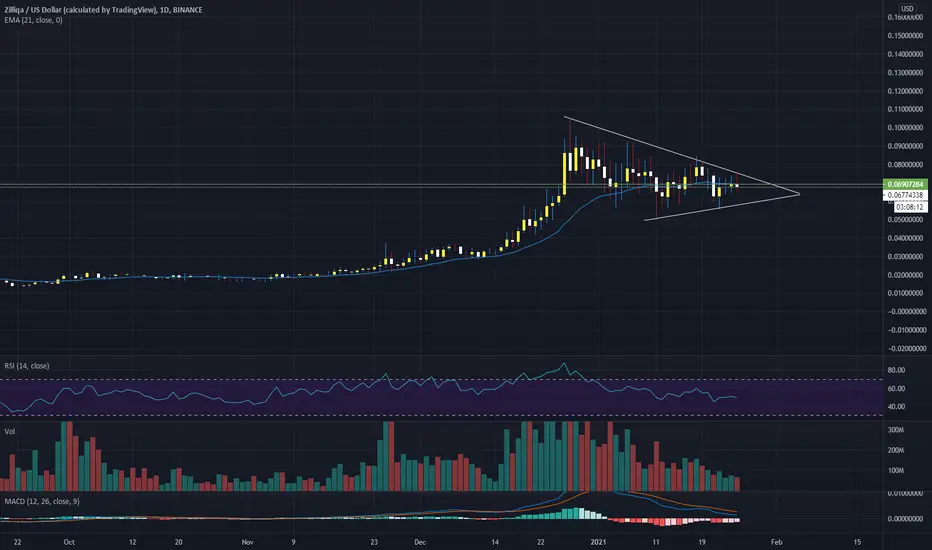
$ZIL Daily looking BullishZIL has broken out of its massive Daily bull flag. Looking at the R1 around $0.11 as next target and hopefully turn that R1 into support to go to $0.13 to $0.15. The MACD about to cross over to bullish on the Daily. Once Zilliqa is able to do cross chain bridge with Ethereum we will see massive upside and most likely ZIL getting into top 10 by market cap. Have fun.

ZILLIQA: breakout and retest expectedZilliqa expected to breakout from resistance then retest it/resistance turned support then shoots for the sky....

A quick 48Day % analysis of $ZIL's performance vs $BTC and Alts.It's been a hectic day at the office of late, and I thought maybe I could do something different from my usual Elliot Wave analysis.
I wanted to really find out for myself, how $ZIL has been performing since the turn of Dec 2020, and I apologise in advance if you find this date a little biased -- because I don't.
This is a feel-good % chart that shows me just how underappreciated $ZIL's performance has been, thus far.
If one is stacking sats, in a little under 2 months, you can't do any better than $ZIL (well, actually you can, but that's for another chart...).
So why am I doing this chart again?
Simple, I am simply trying to figure out an underappreciated gem to rotate into, and as it stands, $CRO has caught my attention.
Until next time, cheers.

Many bullish signs in major alts and sleepers..Zilliqa having a serious clear broadening wedge.. which could go even up double or more..
Vechan similar with a broadening pattern as well.. which I cannot really believe as they are both between 0.8 and 1.5 billion usd cap coins..
I'll post lower market cap coins more later

Zilliqa Bear ScenarioA plausible bear scenario and with current price action it looks like the bulls are done buying. If BTC dips harder than I believe zilliqa will reach the 3 cent area.

ZIL 2021 Targets - Where my current thoughts are at for Zilliqa Almost 2 years since ATH. Fib drawn from May 2020 where I see the breakout starting to happen (also falls in line with ATL). If ZIL goes to ATH it would be a full 1 to 1 retracement. Recently hit key physcholigical level of $0.10 and has since done a very brief .5 fib retrace and is now attempting to find support around the .382 fib which historically held as a support for a short while after ATH. From ATH (May 2018) to breakout (May 2020) is almost dead on 2 years. Was May the initial signs of an upcoming parabolic run.
Currently studying EW and I am seeing a possible 1st wave on the daily (from breakout) to wave 2 which takes us to October/November driving us up into wave 3 but this is unconfirmed (and I am still learning EW), subwaves identified and I am expecting that if this is the case we are on wave 4 with wave 5 to take us to a retest of that $0.10 level. If we can break that then I am targeting a .236, .382 and ATH. Taking profit at each stage and reassessing any changes along the way.
Mainnet upgraded, bridging the ERC token gap, scalable, very community driven and very interactive with the community especially with the launch of Zeeves.
Always DYOR, this is not financial advice, do not take it as financial advice. I am always up to being challenged so if you disagree with something let me know, it is how we learn and grow


ZIL 2 hour Chart AnalysisThis is not financial advice. This chart is only my opinion and what I believe may happen. Please do your own DD when trading.

Cardano Following Zilliqa - UPDATE close up fractalCardano Following Zilliqa - UPDATE close up fractal
In the title. See related idea, this is zoomed in on that idea.
Lets see how this unfolds, so far so good.

ZIL/USD 2 hour chartThis is my opinion on what could happen to ZIL. Currently, there is a bullish hammer pattern forming.

Could be wrongMoney from BTC is coming. Waiting on the 50% retracement but it should happen soon. Buy the dip. The fractal I took is only from the one on the elliot wave. I think .30 is coming.

Bullish Flag Clear bullish flag has formed and about to break out in a direction most likely favoring respected bulls.
Peace, Ardalan

ZIL about to break out of the inverse head and shouldersBig moves might be coming for Zilliqa very soon.
