ZILLIQA According to the M.A RSI SYS and the WOLFE WAVES sequence, the price will search for a balancing point as shown.
Enjoy
ZILUSD trade ideas

Ziliqua Elliot Wave Analysis key buy areaAdvanced Elliot Wave analysis as depicted on chart.
Please like and follow for more!!

Zilliqa ($ZIL) DTF FIB$ZIL BULLS apply buying pressure at $0.1263 FIB support. MACD showing some weakness but I am hopeful from a bounce off the BB MB

ZILUSD LongZil has gone down about 50%. I'm buying the fear because I think there is a chance of an optimism bounce. My stop loss is under the current low and if it doesn't hold I'll reevaluate. If it breaks past the vwap I'll update on taking profits.

Zilliqa Take-Profit ZonesMy guess regarding potential price point probabilities and exit points. I think hitting the 11.1 extension is a stretch on this one, but this a hunch and nothing more. Some of these assets can obviously far surpass targets in a final impulse wave (or even fall far shorter, hitting minimum extension levels), if this is in fact what it appears- a final 5th impulse wave.

ZIL targets no less than 10x from hereMeta formerly known by Facebook has been commenting many times on Zil Twitter account. Zil looks very promising project. Also, the chart here look perfectly shaped cup & handle on the weekly time frame.
Targets:
T1: $0.9
T2: $1.5

Zilliqa ($ZIL) DTF New FIB$ZIL DTF with a power move UP with aggressive sellers trading the top. Should be zero selling pressure since Metapolis hasn't been officially released yet but alas, we have short sighted people giving away their $ZIL. We can expect another BULL move up as oscillators are looking super strong

Zilliqa POTENTIAL TARGET: $6 (£4.50)- I have held ZIL for around a year now and its gone up nearly 250% in the past 7 days :D
- If ZIL hits the 34 FIB EXTENSION we could see a $6 (£4.50) ZIL.
- I am still educating myself on how to use FIBs properly so please don't take this as financial advice.

ZILUSD 1W Cup & Handle 31/03/22ZILUSD is showing potential cup & handle structure.
Since March 2020 we have seen a wave 1-5 up to ATH, with an almost year-long ABC correction from May 2021 onward. From the base of C, which is the 0.382 fib level of wave 1-5 (shown as 0.618 on the chart for target extension purposes above), we've had a large volume move,
From Elliot wave theory we may deduce that this recent large volume move may have been an impulse wave 1 of the next 1-5 wave up. The RSI is trending at extreme positive and stochastic momentum has crossed up. As this is a weekly chart (a slow mover) this may dictate that the next up oscillation has started, but should logically take many weeks to play out.
For ZILUSD to maintain this healthy posture, it must now on a weekly chart maintain its RSI above 50 (or preferably inside the blue bullish control zone), alongside stochastic continuing upside and breaching the 50 level (without contracting) for confirmation.
This most recent volume move has been large and quick, therefore I am expecting some sort of slowdown here (also to be dictated on this weekly close if RSI closes with a decreasing positive gradient). Healthy price action would be to range below ATH, potentially for several months, to gather strength for the push upwards (as drawn in red pen).
There is of course possibility for this to continue up from now, however, is a less probable scenario considering the % gain seen in the past 2 weeks., and the fact that price felt resistance and stopped at the range of the previous high at wave 5.
Looking at the 1D timeframe, there is also a potential 1-5 micro wave completed here:
A worrying scenario would be losing the 0.786 fib level on large volume red candles, and invalidation for the current handle comes in at breaking wave C at the 0.618 fib level.
Not financial advice and always DYOR .

ZILUSD with a pump no one expectedOn the 1 day chart it was hard to find a legitimate chart pattern to justify ZILUSD’s sudden pump here but once one flips to the weekly chart this pattern emerges. This triangle is probably more valid on either the 2 week or 3 week chart than it is the 1 week considering how many weekly candles we closed outside the triangle before we saw the breakout. Judging by this pattern ZILUSD still has a little more room to move up on this current breakout *notfinancial advice*

ZIL USD GAN FANN ZIL broke out of it's macro Gann earlier in the year, it is in a micro. Break 8/1 and moon.
DERIVED FROM 3D CHART

$ZIL LEADINGpractically 1 year of consdolidation for zilliqa
after the ATH is the 1.618 and 2.0
great volume
lots of room to run

ZILUSD Aggressive BreakoutZILUSD has broken out spectacularly!
On this Monthly chart you can see how price has cleared the upper band with a clean bounce off the 0.618 fib line
Price will continue upwards on this monthly timeframe, as the next candle is only a few days away, continuation
Gratz to hodlers

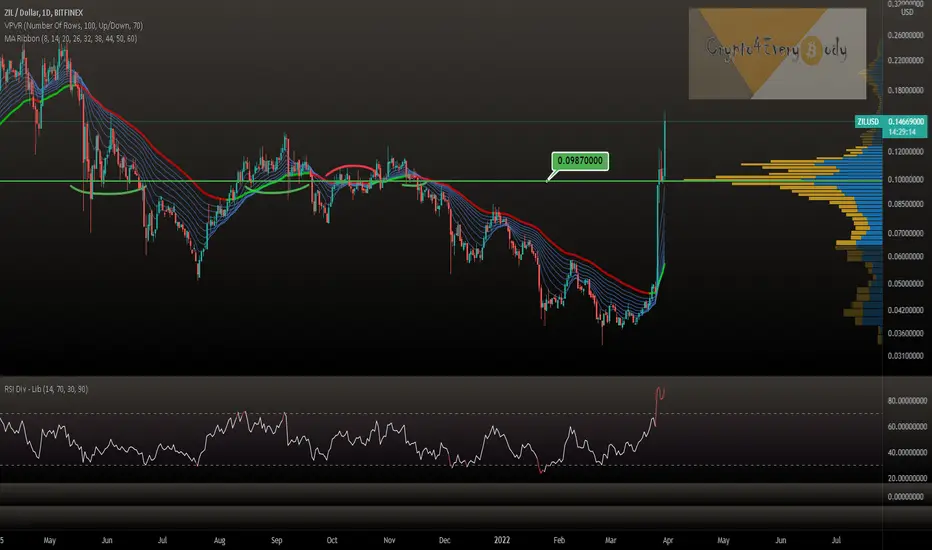
Zilliqa ZILUSD with a huge bullish move - $0.0987 now supportZilliqa ZILUSD with a huge bullish move - $0.0987 now support
This is the volume profile price level that was resistance / support in the past.
ZIL flipped the MA Ribbon indicator bullish and now broke this huge volume level.
Great, isn't it?
Drop me a nice comment if you'd like me to analyze any other cryptocurrency.
*not financial advice
do your own research before investing
Falling wedge short term. Be careful hereI am not persuaded in the least to FOMO into ZIL at the moment. Should we break back above this falling wedge and back test 10.5 cents and hold...then yes...I will start to scale in.
A break below this falling wedge will indicate short term bearish price action with a resistance around 9.5 cents. Good luck. May the Metaverse be with you.

A Bull's Wet Dream SetupContext:
Red: Resistance
Green: Support
Gray: 50 SMA
Yellow: 20 MMA
Blue: 50 MMA
After a 300% increase in price, caused by their recent merger PR and anticipated April 2nd Metropolis event (meta) Zil settles at 10 cents, give or take 10% fluctuation.
All recent areas of breakout have been confirmed signifying healthy movement.
The current pattern visible is the infamous stair step pattern, whereby each leg up is followed by consolidation sideways before the next break above.
Ultimately, looking for Zil to tap 20-30 cents within the next seven day cycle given all the above.

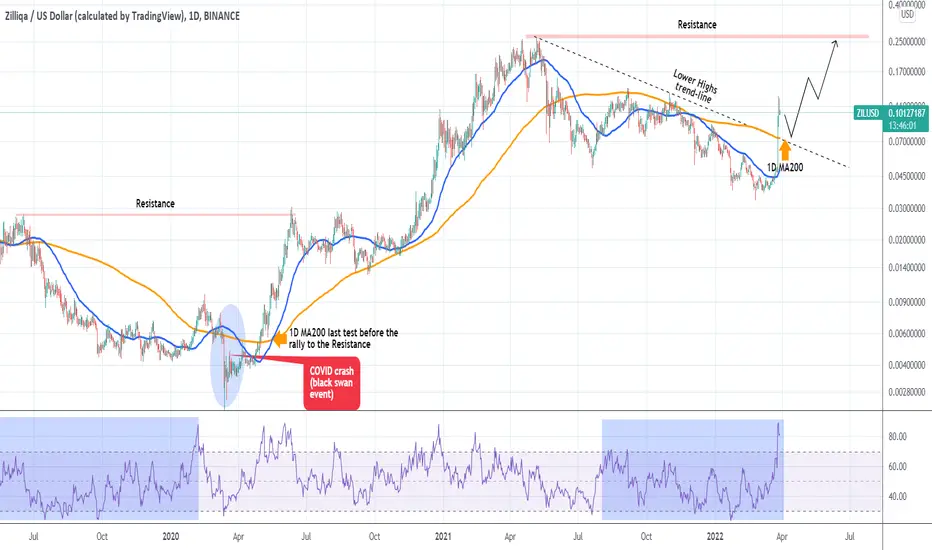
ZILUSD Strong break-out but wait for the MA200 if you missed it.Zilliqa (ZILUSD) is on a strong bullish break-out since Saturday, having broken above the Lower Highs trend-line of its May 06 2021 High. At the same time it broke above the 1D MA200 (orange trend-line) as well, which should now act as the long-term Support if the market is to build a sustainable uptrend from now on.
If we exclude the COVID crash of March 2020, we see a similar bullish break-out on ZIL during the last Cycle. The 1D MA200 break-out on February 03 2020 was followed by this Black Swan event and after the market stabilized, ZIL made a last 1D MA200 test before the rally towards the previous long-term Resistance. So if you missed the current break-out, it would be best to wait for a pull-back near the 1D MA200 again, unless we witness another Black Swan event, which of course don't come and go every year. Our projection is that ZILUSD can test its 0.2600 - 0.2700 Resistance Zone by the end of June.
--------------------------------------------------------------------------------------------------------
** Please support this idea with your likes and comments, it is the best way to keep it relevant and support me. **
--------------------------------------------------------------------------------------------------------
Zilliqa ($ZIL) New DTF FIB$ZIL DTF higher highs and higher lows. Oscillators both solid despite aggressive traders taking profits

Not so fast my Pretty!We are WAY OVERSOLD on the hourly, 4 hour, 12 hour, and daily...LOL...this seems to another one of those BUY the RUMOR...SELL the news scenarios...
If ZIL can HOLD and successfully retest 7.5 cents...then I'm a believer....other than that that...Metaverse is nothing but pure hype!

ZILLIQA road to A NEW ATH This TA should have been posted yesterday, I shocked when I found it not posted yet !
Zilliqa fundamentally good project, many partnerships regarding metaverse in the last period.
Technically, chart is very very strong !!
- 5 Elliot waves already done till MAY 2021 peak.
- Correction started that time & have just ended.
- Correction completed in ABC pattern.
- Price cant go below 3 cents ( wave 1 peak)
- Targets during 2022 may reach up to 80 cents.
HODL HODL HODL HODL

Zip target 0.44Zil will break out all of the resistance,buy spot and hodl
Zil will reach 0.44 in a few days

Zilliqa (ZILUSD) with a huge bullish move - $0.0987 to breakZilliqa (ZILUSD) with a huge bullish move - $0.0987 to break
This is the volume profile price level that was resistance / support in the past.
ZIL flipped the MA Ribbon indicator bullish - will we see a correction or a break of the resistance?
Drop me a nice comment if you'd like me to analyze any other cryptocurrency.
*not financial advice
do your own research before investing

