the buy area and targets of Zilliqacrab harmonic pattern:
AB=0.61 XA
BC=0.38 AB
1.6 BC=$0.052
2 BC=$0.0738 *third buy point*
0.78 XA=$0.0864 *second buy point*
2.24 BC=$0.0912 *first buy point*
2.6 BC=$0.127
0.88 XA=$0.138
3.6 BC=$0.3
1.13 XA=$0.432
1.41 XA=$1.6
1.6 XA=$4.25 *HODL till here*
ZILUSD trade ideas


ZIL Zilliqa Price TargetZIL Zilliqa Bullish Divergence Chart Pattern!
This is a buy signal.
Price target 0.095usd.
Looking forward to read your opinion about it.

Zilliqa ($ZIL) FIB Zilliqa ($ZIL) FIB : $ZIL mini-pump still in play as RSI and MACD shows good improvement. $ZIL strong support at $0.0535 tested 5 out of 6 D and strong resistance at $0.0626 tested 6 out of 6 D. Consider levels lower than this an even better deal than current prices
OPPORTUNIES EVERY WHERE ZILHello guys, we follow the chart not the news , another accumulation zone to buy and the next buy order is indicated.
Tradehubng

Huge Cup and Handle Pattern on ZilliqaZIL just formed a huge cup and handle pattern on the weekly chart. This pattern only will be confirmed if the price closes a weekly candle above ATH at 0.2355. At first it has to break out from the current descending channel which is the handle of the main cup and handle pattern. The pattern projection is $25! the first targets for the bullish scenario are $1, $4.2 and $6.5. In the bearish scenario supports are 0.029 and 0.014.

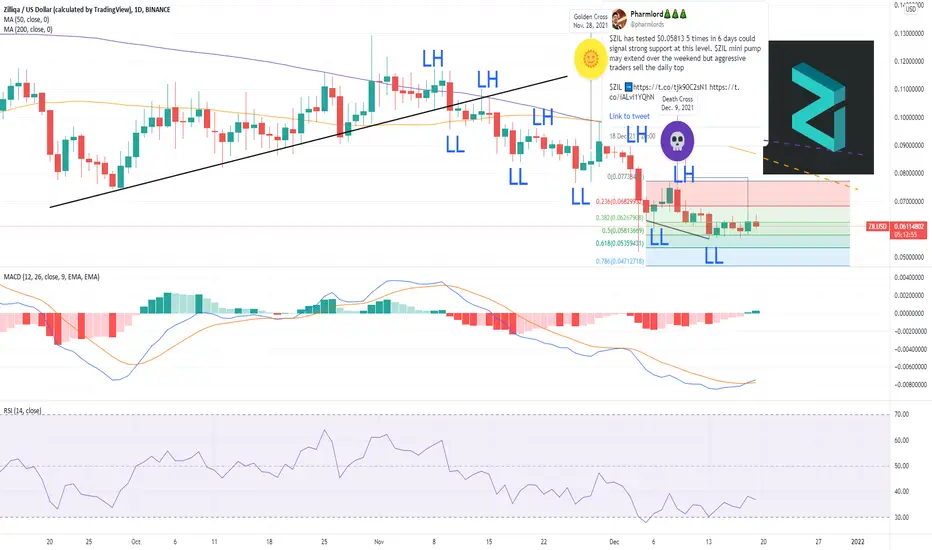
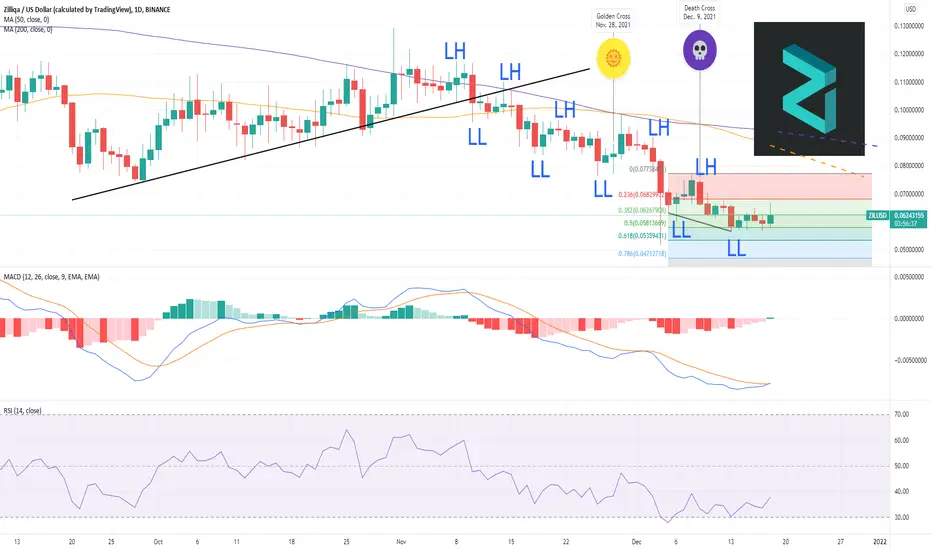
Zilliqa ($ZIL) FIB$ZIL has tested $0.05813 5 times in 6 days could signal strong support at this level. $ZIL mini pump may extend over the weekend but aggressive traders sell the daily top
Zilliqa ($ZIL) FIBZilliqa ($ZIL) FIB: $ZIL RSI is beginning to show real signs of life and MACD looks to improve its trajectory up. DEATH CROSS can be avoided with $ZIL testing $0.0737 resistance on a day with a bit of indecision

ZIL Crypto (Dip Buy Opportunity) - Bearish Shark HarmonicPrice is currently at an entry zone to buy the dip for the ZIL Cryptocurrency.
There is also bullish divergence occuring at the entry zone to support a bullish reaction.


ZILUSD IdeaAn idea suggesting a big moonshot for ZIL
This is based on the previous move to ((2) in green)
A large ascending broadening wedge can be plotted if this bars pattern is placed this way
The placed pattern up is very very speculative, but it really does look bullish above this level
Always make your own assessment. Personal judgement on charts wins every time.

ZIL - Off the Lower BandIn a late Sunday move, grossly undervalued ZIL wakes up and pops off the lower Bollinger Band.
The Stochastic indicator shows ZIL coming out of an oversold sentiment as buyers gobble up the cryptocurrency.

The monstrous $ZIL Idea: likely to retest $0.069 shortterm.NOT FINANCIAL ADVICE
The abbreviated long story:
Ichimoku: Bearish
EMA: Bearish
Wyckoff: Bearish
CT: Slight Bearish
F&G: Bearish
HA: Bearish
RSI: Bearish
Trendlines: Bearish
Elliot Wave: Bearish
Fundamentals: Slight Bearish
EcoSystem: Slight Bullish
The summarised short story:
1) Shortterm retest of $0.069
2) Next support at $0.059
3) Last support at $0.050
Apologies for the lack of words with this post.
Happy trading~

Zilliqa (ZILUSD) has to decide - OBV breakout aheadZilliqa is at a critical point if it want´s to participate in the rest of the bull market.
If the OBV can not breakout above the red resistance trend channel... the support below is to close.
It is getting exciting ;-)
Drop me a nice comment if you'd like me to analyze any other cryptocurrency.
*no financial advice
do your own research before investing


Zilliqa Impulse ComingZIL looks bullish here
Long term diagonal support is intact
a strong impulse to the upside is coming

buy the dip and HODL till $4crab harmonic pattern:
AB=0.61 XA
BC=0.38 AB
tp1=1.6 BC=$0.052 *reached*
tp2=2.6 BC=$0.125
tp3=3.6 BC=$0.297
tp4=1.6 XA=$4.24

$ZIL PLANEither reclaim daily uptrend or reject. Lets see, both direction could give opportunity to take trade

Zilliqa ($ZIL) New FIBZilliqa ($ZIL) New FIB:
$ZIL losing strength in MACD and RSI while it attempts to turn $0.0956 resistance into support. $ZIL BULLS are buying the dip from today's low

ZIL - OversoldBeen looking for a good entry on ZIL for a few months now, but have been reluctant to add another crypto to my collection. The way ZIL has held up in this BTC downturn has inspired me to get in now, before I miss out on a good opportunity.
A bit early entry on this, as you can see that ZIL is still resting on the lower Bollinger Band, and is in the sell zone, below the 20 DMA.
But I'm more focused on the Stochastic, as it shows that ZIL has been oversold, and is coming out of it.

Zilliqa ($ZIL) New FIBZilliqa ($ZIL) New FIB: $ZIL BULLS are doing their best in buying the dip as the 1D candle sits on the edge of the 50MA. $ZIL needs to close above the 50MA to prevent the next leg of the downside. Am I worried? Nope! Am I DCA the dip? Yes!
Zilliqa Looking for a Bounce!Zilliqa has been slowly moving up along out uptrend support line but has felt BTC's sharp drop for sure, we are looking okay though we are approaching the 0.2 FIB level which intersects with the uptrend support level so we could be looking at a likely bounce zone, now keep in mind a lot rides on BTC and this could all be voided if BTC continues to drop. Now look at the bollinger bands we have fallen underneath the midline which is now resistance but if you notice how much the bands are squeezing this indicates volatility is shrinking and an explosive move is on the horizon, now the BB's don't indicate which way but if we do see this bounce we could have a good chance of rebounding to the upside and hopefully kicking off this explosive move in the right direction. Something very important that we must keep an eye on is that bottom band, we definitely don't want to move down further and risk grabbing onto here because then we would be in for a very steep move to the downside, historically grabbing this bottom band leads to a correction, could be big small or medium sized and then pair that with the squeezed bands.. it would not be a very enjoyable ride lol, but hey it could definitely provide a great buying opportunity worst comes to worst. Now the pivot bands, we have already wicked off the red pivot band once and now if we continue to do so in the coming days it is very likely this will lead to a jump up in price action, check out the far left of the chart we had many touches on the red band and what followed right after was a big rally to the upside, same thing moving more recently, i have marked wick touches with white circles and you can see that when we have less touches we have a smaller move in the opposite direction. SO all it really takes is 2-3-4 wicks onto one of these pivot bands until we could see a move in the opposite direction. Now the Wavetrend, we are coming down fairly rapidly but what caught my eye is that we have obvious uptrend support just underneath our current spot leading me to think this also plays into us having this potential bounce, we want to see the wavetrend start to slowly curl to the upside and remain that way before we can confirm anything, we also do have support coming from the midline so that is another area where we could see this play out! Not financial advice just my opinion!

ZIL - Ascending TriangleUPT:
0.12
0.15
0.17 - 0.18
DPT:
0.074
0.05
Price Action is KING!
More power to all your trades, my friends!
Ron
Intrepid_Trader
