ZIL/USDT TRADE SETUP! 60% PROFIT POTENTIAL!!Hello everyone, if you like the idea, do not forget to support it with a like and follow.
If you follow me then you must make some good money in the past few days. If you are reading my post for the first time then I tell you, I have shared many Alts like ARB (50% UP), BNX 30% UP), HOOK (50% UP), EGLD (15% UP), SAND (15% UP), and many more. You can check all these setups in my profile.
Remember this is just the start of the Altseason so do not Fomo As I said this is Altseason not an Alt day so we get more and more opportunities in the upcoming months.
Here is our new setup.
Welcome to this ZIL/USDT trade setup.
ZIL looks good here. Breaks out from the cup and handle pattern and currently retesting the neckline. Also, they will launch EVM Compatibility next week. So I'm expecting a good pump from ZIL in the next few days. Buy some here and add more in the dip.
Target1:- $0.036
Target2:- $0.040
Target3:- $0.044
Target4:- $0.050
SL:- $0.0295 (Do not trade without SL)
Buy on spot or you can use low leverage with strict SL.
If you like this idea then do support it with like and follow.
Also, share your views in the comment section.
Thank You!
ZILUSDT.P trade ideas


ZIL S&R In mid-term>>>>>I Have Tried My Best to Bring the best Possible outcome in this Chart.
Must important level's marked on the chart.
It's just an analyze,Not signal
Not a financial advise.
PLZ DYOR
With hopping success>>>>>>>>

#LQR #TOBTC #Zil Zil in under a Great Cluster Dynamic and static resistance which is around 0.03510 - 0.03699
those price are important for zil breaking this level needs to stay and Close a Daily Above


Crypto ZILUSD (The UPtrend is intact)
View On ZILUSD (18 Apr 2023)
ZIL is in
* Slightly Bullish in short term (Intraweek)
* Slightly Bullish in Mid term (1 to 3 months)
* Bullish in Long term (3 months onward)
ZIL is in the decent UPtrend and we have ample of support of nearby.
Good supports are 0.028 and 0.022 will be good supports.
Sooner or later, it shall go UP further.
0.036 will be the next good resistant.
DYODD, all the best and read the disclaimer too.
Feel Free to "Follow", press "LIKE" "Comment".
Thank You!
Legal Risk Disclosure:
Trading crypto, foreign exchange or CFD on margin carries a high level of risk, and may not be suitable for all investors.
The high degree of leverage can work against you as well as for you.
Before deciding to trade foreign exchange you should carefully consider your investment objectives, level of experience and risk appetite.
The possibility exists that you could sustain a loss of some or all of your initial investment and therefore you should not invest money that you cannot afford to lose. You should be aware of all the risks associated with foreign exchange trading, and seek advice from an independent financial advisor.

$ZILremembered ZIl after posting ankr
reclaimed 200 ema stop below yellow line recon we finally go for the magnet
may be fast n furious


#ZILUSDT #LQR #TOBTC #LaqiraProtocol The support and resistances in the chart are specified,
the Levels are obtained from the confluence of fibo and static surfaces,
after confirmation you can open a trade
this analysis is not a buy or sell offer


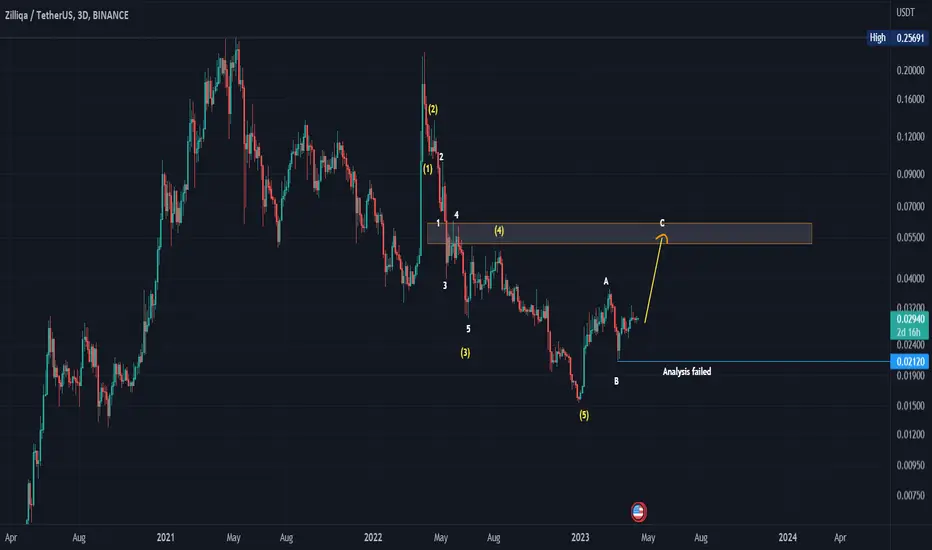
zilusdtWe are waiting for the C wave to complete with five motive waves for the shaded area
Note: The analysis fails if it closes below an area 0.0212
ZILUSDTI see her going up. But do not guarantee and raise your endowment when you are on a profit and are not greedy

#ZILUSDT bullish positionFast movement and slow correction on the trend line can be a good sign for ZILUSDT to go up
Convenient location with excellent R/R
Enjoy

zil/usdtZilliqa is a public, permissionless blockchain that is designed to offer high throughput with the ability to complete thousands of transactions per second.
Now it is showing weakness

Probable outcome for ZIL - 0.7$Probable outcome for ZIL - 0.7$, why? no idea also random abcde waves to seem legit

ZILUSDT- Long Scalp Simple Trendline breakout in low time frame.
Take this position only if ETH hold this 1hr Candle otherwise trade invalidate.
TP/SL on chart.

ZIL on spot 🔥#new_update
🤠🏹 ,,,,,,,,,,,
#ZIL on ( spot ) ,,,,,,,,,,,,,
🟢 Safe entry price 👇 ,,,,,,,
Starting from 0.02730 to 0.02880 ,,,,,,,,,,,
🔴 stop Loss ,,,,,,,
0.026 ,,,,,,,
targets
0.03630 ,,,,,,
0.042 ,,,,,,,
0.048
profit rate 70.87% ,,,,,,,,
average loss 6.75% ,,,,,,,,
✅ (🔴 8:1 🟢)
#Crypto

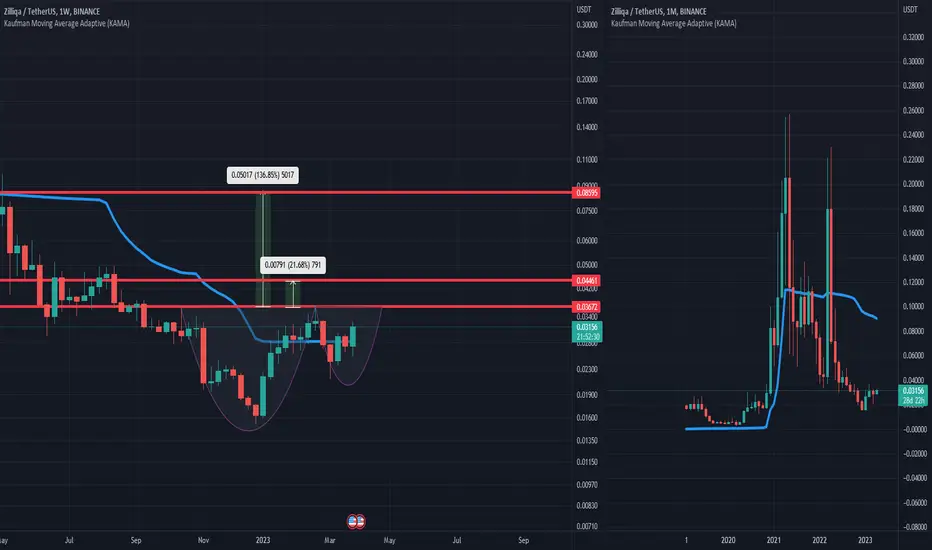
ZILUSDT // cup handle formationWe need closes above 0.03672. Note the wedge resistance in the monthly slice.
ZILUSDT | RETESTING THE BREAKOUTZILUSDT has finally break its 2 weeks horizontal range and currently retesting it. We have harmonic AB=CD pattern which provide upside target of 18 percent.
The only condition here is closing bullish candle on the range top. Good Luck for healthy gains.

✴️ Breaking Up Above Resistance | ZilliqaIt is not only the BTC pairs but also the USDT pairs that are growing now... Preparing for massive growth.
I would say the medium to small cap. ones?
Or the " everything grows phase " sounds more like it.
✔️ Because I see big capitalized Altcoins moving up above resistance.
✔️ I see the small and mid sized Altcoins moving up above resistance.
These are the USDT pairs (ALTSBTC).
✔️ Now, I am also seeing the ALTSBTC pairs recovering after a strong correction, completing the entire picture, all groups set to grow.
Bitcoin remains really strong consolidating at resistance... If a small retraces or sudden drop happens, this would result in the Altcoins making a strong jump.
If BTC remains sideways, the Altcoins grow... Whatever happens the Altcoins are set to grow right now.
ZILUSDT, the big green arrow seems like an exaggeration but works for illustration, that is what I see coming all across.
This is me generalizing, there are tens of thousands of Altcoins and even more trading pairs.
Some pairs are at different stages and some are going to be left behind or already moved in the previous wave.
Do your own research and build a plan... This will lead to success.
Namaste.

#zil I can see one of the cleanest charts in Crypto.
both scenarios can give back 55X (5500%) for those who want to invest.
NFA


Zilliqa will continue uptrend? Now zil is fighting with fibo 0.5 and resistance line 0.294$
If it can breaks it and goes forward we have good chance to take good profits from this crypto.
