ZIL has 2 possible movement scenariosZIL has created an Inverse Rounded Bottom Pattern which means the price should do a bit of correction and goes bearish for sometime. the Pattern has not been broken yet but when it happens, the price shall Decrease as much as the measured Price movement which is shown on the chart.There could be another Scenario which will be that the Price breaks the pattern Upwardly and Reach the resistance level that is shown on the chart and why is that possible? well if you pay attention to RSI, you can see that the price has reached the oversold area which is a bullish signal so we should consider the possibility of a bullish movement as well. The Price shall do a movement pretty soon so we can predict the incoming movement right after.
_ _ _ _ _ _ _ _ _ _ _ _ _ _ _ _ _ _ _ _ _ _ _ _ _ _ _ _ _ _ _ _ _
🌍Thank you for seeing idea .
Have a nice day and Good luck
ZILUSDT.P trade ideas

ZILUSDT time to retracement?ZILUSDT is currently trading inside an ascending channel. However, the price recently got rejected from the daily resistance level at $0.035, which suggests that the market may be experiencing a bearish trend.
If the market continues to decline, there is a possibility that it could retest the Fibonacci area and experience a new bearish impulse. It is important for traders to monitor the market closely and consider applying Plancton's rules to manage their risk effectively.
Additionally, there is a demand zone at $0.028, which could serve as a potential support level for the price. Traders may want to keep an eye on this level and consider taking long positions if the price bounces back from this zone.
–––––
Follow the Shrimp 🦐
Keep in mind.
🟣 Purple structure -> Monthly structure.
🔴 Red structure -> Weekly structure.
🔵 Blue structure -> Daily structure.
🟡 Yellow structure -> 4h structure.
⚫️ Black structure -> <= 1h structure.
Follow the Shrimp 🦐

MICRO UPDATE ZIL -25% 🩸These trades reflect my trading history and are not investment advice and I am not your financial advisor
Trades will be updated on the same published chart such as Take Profit, Early Exit or Partial Exit..... Good luck to all


ZILL/USDT Relative Strength Index Zill / USDT 3h Binance pair Shows Long Position , Because Relative Strength Index reverse after touching 30% lowest bar mostly Time Frames Shows Long Position According to RSI expect of 1day . if you have any other idea abour zillqa plese share your idea.

ZIL TO BUY AND TARGET 0.034 PRICEZILUSDT Analysis
On the 1H timeframe market is at bullish and we are seeing price respected Trendline and we are seeing a new uptrend. so in a few days price will go up to R1 and after some retracement, it will target 0.034usdt.

Zill golden crosszilliqa is ready to pull one of its famous pumps after this golden cross...maybe but technical indicators show a probable 40% there is a bit of resistance between here and there MARKED OUT ON CHART
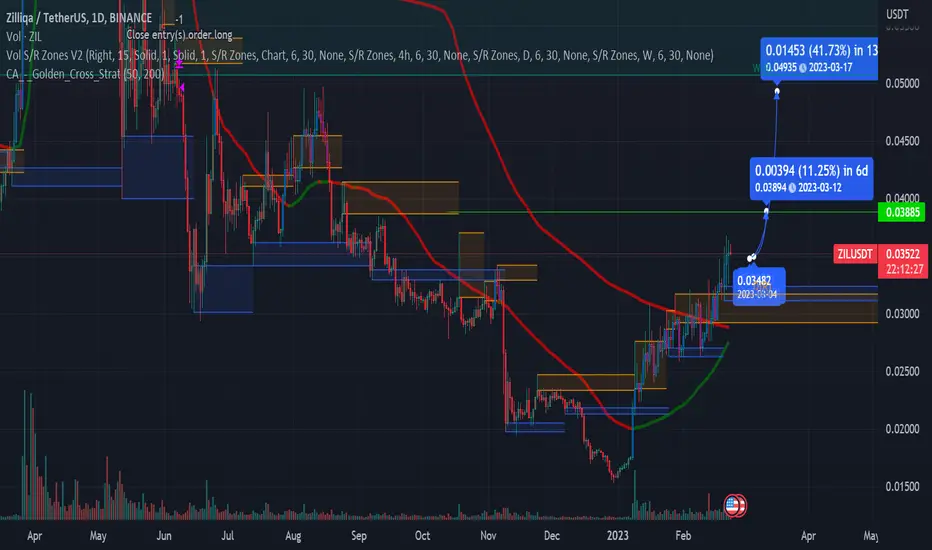

ZIL update 20-30% move incoming Big breakout updateNot financial advice
This is an update from an earlier chart I posted.
But if we maintain a .034 daily close we have a target of .0465
1st take profits be the 200 week moving average of .043 followed by .046
Then let's see if we can nail it up to .07c that's a big if but let's see.

ZIL must hold .0273 to long to .034. lose .027 range .019 incomiNot financial advice
Trade going forward
Must keep 4 hour closes above .027 for a long to .0343 area
Wait for retest .027 to see if it holds and take a long to .0343 area
Currently in a bearish wedge
Where .0273 must hold we lose that number on a 4 hr close.
Target would be .0197 entry
Target is derived from taking equal measure move up to wherever the trendline breaks you would subtract the same 27% move to the downside for the target.
But this is a good thing.
It is still a lower high setup on a longer time frame from it's low currently of .015
Remember to practice patience
#PIK
Patience is Key
#TLAW
Think Like A Whale

ZILUSDT H&C"Cup and handle is a technical chart pattern used in trading and investing to identify potential bullish continuation patterns. It is formed by a "cup" followed by a "handle."
The "cup" is a U-shaped curve that is formed when the price of an asset rises, then falls back to the same level or slightly lower, and then rises again to the same level as the first peak. The "handle" is a small downward price movement that occurs after the peak of the "cup" formation.
The pattern is considered bullish because it suggests that the market has reached a bottom and is now ready to move higher. Traders often look for high trading volume during the "cup" formation, which indicates strong buying activity, and lower volume during the "handle" formation, which indicates a consolidation phase before the asset potentially moves higher." - ChatGPT

$ZILUSDT: Low risk buy signalWeekly trends have often been a good way to ride crypto swings, so I keep an eye on them. Nice setup here in Zilliqa's chart.
Best of luck!
Cheers,
Ivan Labrie.

$ZIL ZILIQA SWING TRADE IDEAFlip and hold 0.0365 for a swing long on ZILIQA $ZIL. Key levels marked for trading

ZILUSDT can produce a massive jump of nearly 60%ZILUSDT resistance became the support, while the price continues to produce HHs and HLs. This is a strong bullish pattern and there should be a continuation of the uptrend, potentially going exponential.

ZilUsdtZilliqa good position you can wait on entrypoint buy
i try show you all targets for all time frame
GL
EntryPoint:
0.02900
0.02650
Supports;
0.02360
0.02145
0.01950
0.01700
Resistances:
0.03200
0.03310
Targets:
0.03700
0.04055
0.04445
0.05060
0.05960
Midtime:
0.07350
0.09600
0.12895
HODL:
0.15890
0.20725
0.27815
GL

$ZIL -updateclosed above H4 200 ema and key resistance most likely we go test it to conifrm the flip
Reset stoch on H4 and lets go get .44 zone or just go from here :)


Entered a buy on ZILWhy? well for starters ZIL has made a HH so broken structure to the upside and has now re tested demand. Target is to break the HH.

ZILUSDT | KEY LEVELZIL after breakout has been trading in a bullish trend .
The price has now been trading in a rising channel .
The price has been converged.
The price is currently trading at higher side of channel
Now bulls need to break above the triangle.
Manage your trades accordingly.

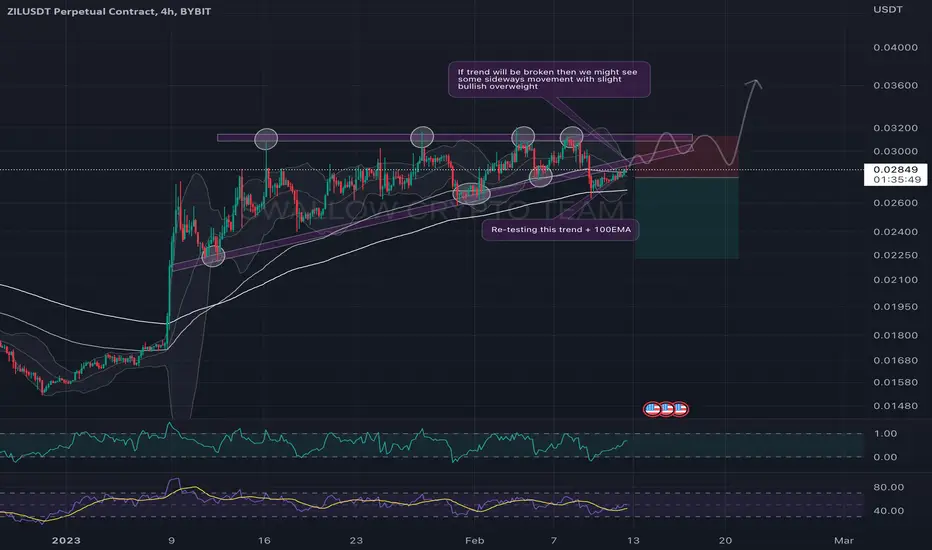
ZIL/USDT going to the retestHey, guys ✌️
ZIL/USDT has been a coin that we wanted to take a look at for some time now. Well after breaking that trend two days ago price fell until the meeting of 200EMA - from there it pushed the price back up and now we are here at the retest of the trend and 100EMA as well.
We are waiting for clean breakout or clean rejection from that trend in order to take any position here. This trend sees strong with 100EMA as a backup there as well. Let's wait and see!
If you like ideas provided by our team you can show us your support by liking and commenting.
Yours Sincerely,
Swallow Team 🔱
Disclamer:
We are not financial advisors. The content that we share on this website are for educational purposes and are our own personal opinions.
Fast long on ZILFast long on ZILUSDT. The idea that we move in the flat channel and now after bottom line will move to up level of this channel. Will see...

$Zil Either wayDoesn't matter wich way it goes
Orders both ways
There's 8% swing to the upside if btc holds 21.5
There's 12% swing to the downside if .026 support fails

Zil 15mins shortI have a short spot of this trade using gartley chances to be weak in this area; entry point with a big candle rejection confirmation
