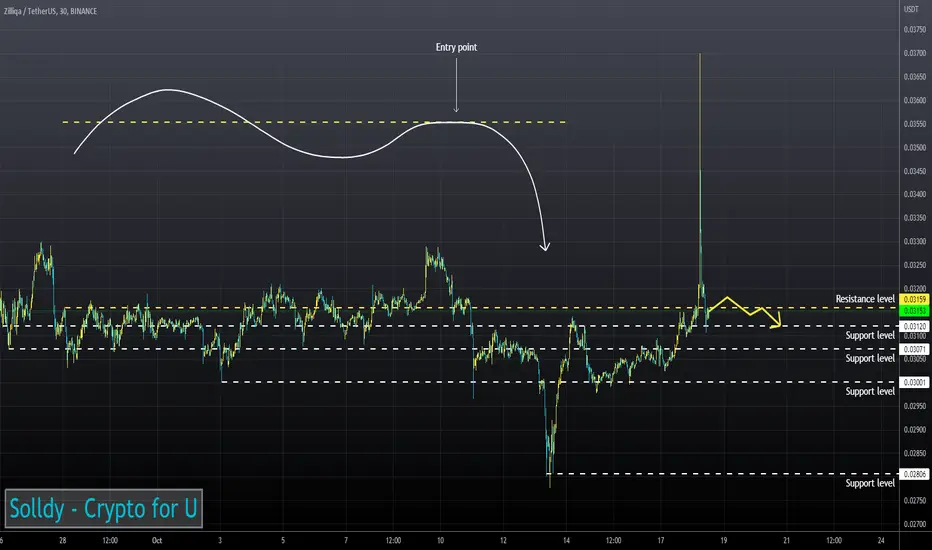
ZILUSDTZill about to explode.
20/50 EMA cross close
Volume way above average.
Great opportunity long here
ZILUSDT.P trade ideas

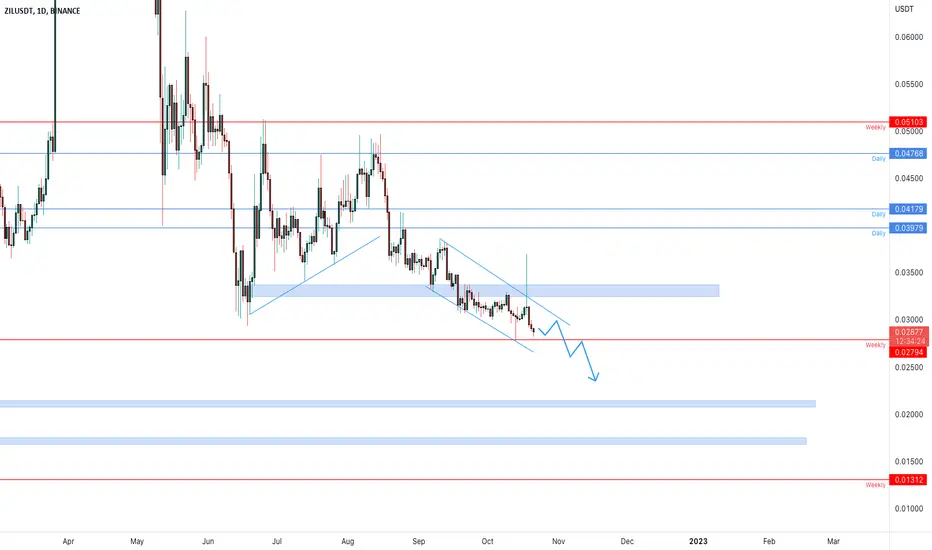
ZILUSDT is testing the weekly supportThe price is testing the weekly support after a false breakout from the descending channel above the 0.028$ area.
How to approach it?
IF the price is going to lose the support and retest it as new resistance, According to Plancton's strategy , we can set a nice order
–––––
Keep in mind.
🟣 Purple structure -> Monthly structure.
🔴 Red structure -> Weekly structure.
🔵 Blue structure -> Daily structure.
🟡 Yellow structure -> 4h structure.
⚫️ black structure -> <= 1h structure.
–––––
Follow the Shrimp 🦐
ZIL/USDT DOWNUP SWING TRADE my plan ZIL/USDT |write exactly text| showed excellent growth and is now in correction, the bull flag is moving in the figure, I designated it as a parallel channel, the closest trade will be from the 14xx zone with the target of 1740 cents, the second trade from the zone of 0.011xx with the target of 0.014 and try to drag higher to 0.027
Swing trade
Trade 1:buy 1450 sell 1740
Trade 2:buy 1150 sell 1420

Zilusdt Long📈N.B. Follow me for more analysis
Trading proposals post based on price action,
technical analysis, major intraday supports
and resistances, rejections, breakouts, chart
patterns and other factors.
How this analysis was done:
First I find usdt pairs using crypto screener then if all Three×3 in 1 indicators gives main entry confirmation at the same time I go with the analysis then I find Support and Resistance zones in 3x entry timeframe also using one of the three indicators for backing up my analysis and filter bad signals then I also make trendlines using two of the 3 indicators in 3x entry timeframe for filter out more bad signals then again using one of the 3in1 indicators I filter fake breakout in entry timeframe and in higher time frame and then if other minor conditions is confirmed the analysis is done.
Take Profit:
Blue zone is potential reversal zone
Take profit is dynamic/trailing stop loss/take profit
Stoploss:
Stoploss is above/below swing high /low
Trading and investment in the financial
markets always involves high risk, So In order
to succeed using our signals make sure you
have learned the essential skills for money and
risk management
To SUPPORT this channel, please press the
LIKE button, COMMENT and Share with your
friends


ZILUSDT1d Bear trend
w Bull trend
Two options for entry , follow the risk management and don't forget to put stop loss

ZILUSD ❕ pivot pointZIL successfully tested 200EMA as resistance (4H TF)
A reversal signal was formed on the 1H TF down on the TD Sequential indicator.
On the smaller 30m Timeframe on the contrary reversal signal was formed up.
I expect that the price may retest the resistance level, and after fixing under it will continue to decline.
ZİL LONG TREND
#ZİL/USDT
Exchanges: Binance
Signal Type: Regular (Long)
Amount: 2.0%
💎 Entry Targets:
1) 3150- 2970
Take-Profit Targets:
Target 1: 3217
Target 2: 3327
Target 3: 3416
Target 4: 3504
Target 5: 3631
Target 6: 3792
Target 7: 4971
Target 8: 6434
🚫 Stop loss:
2700

ZILUSDTHello Crypto Lovers,
Mars Signals team wishes you high profits.
This is a 4-hour-time frame analysis for ZILUSDT
In this chart, we have R2 as a resistance area which represents the price was not able to rise at several points. R1 used to be a support line and S1 and S2 are our support areas that express the support of price since the past. At the present, there is a reverse head and shoulder pattern seen in our chart and we have the price fluctuating over S1 and our expectation would be a rise toward R1 or R2 and then by a rejection, we believe the right shoulder of the pattern will be completed and the price falls toward S1. Even it is possible for the price to face more decline when it reaches S1.
Warning: This is just a suggestion and we do not guarantee profits. We advise you to analyze the chart before opening any positions.
Wish you luck

Zil about to teleport to XRP prices?Look at the high timeframe moving averages for ZIL (Zilliqa). The last time they looked like this was just before it went up hundreds of percentages.... Does history repeat?

ZILLIQA TIME - DAY TRADESmall update from low time frame for zilliqa for day trading.
it can show some increase in the coming time since algorithmic did confirm this coin.
Its low time as Zilliqa now depending on price action still in the red.
We have seen what for trend ZILL can have since it did last breakout to 0,23
This updates are time frame updates, and choice by best possibility to show at last some increase and this increase can also be reason for more, but this should be updated with time.
There is no guaranty for any trend, its all choice from the best possibilities that are into crypto at this moment.
We use TA, Algorithms and volume tracker on more coins.
90% still its eye work.


Ziliqa good for spot buy all information is on the chart. 4h MS changed from bearish to bullish and the lows have been swept. wait for retrace and long on the 4h OB

ZIL Bull runZIL has retested the neckline break which now imo will be upside to target.
Markets looking good in general, and outside of this (news) is bearish, which imo is Bullish inside the markets.

ZIL Give a try+ Support zone
+ Small SL (5%)
+ Bullish wedge pattern
+ Downtrend line break out
- Can accumulate further
- Can SL

ZILUSDT - 4h Short signal💡💡SIGNAL 💡💡
ZIL / USDT
▶️ Sell in block
🔴 SLT - 4h (trigger)
Selling at a strong level
#ZILUSDT_4h_021022


ZILUSDTThis is what i see , its not a buy or sell signal
Also as an harmonic pattern
This is whatnit should happen
As a SMC i see it has to feul to go up strongly


Zil chart - ExperimentalZil chart using an experimental method. This is not financial advice. Each circle represents a target (as value) and a possible rejection point. This is an inverted chart and the blue diagonal line invalidates the movement in one direction or other.
Falling Wedge 250% TargetPotentially a big move coming, falling wedge, volume is declining, 4hr stochastic RSI pushing up,

DAY: 9 #ZILUSDT (#LONG)DAY: 9 #ZILUSDT (#LONG)
2% of the deposit
Margin: isolated
⚖️Leverage: x10-20
🗝Entry point: 0.03500-0.03519
🎯target 1 - 0.03548
🎯target 2 - 0.03606
🎯target 3 - 0.03668
🎯target 4 - 0.03826
🎯target 5 - 0.03898
❌stoploss: 0.03360
More trading signals and their results, in my channel, link in the description
BTCUSDT - Local review (#LONG) All trading results for 8 days !

ZILUSDTHello Crypto Lovers,
Mars Signals team wishes you high profits.
This is a 4-hour-time frame analysis for ZILUSDT
Here we have R2 as the resistance area which contains the disability of the price to rise. R1 used to be a support area and S1 used to be a resistance line. At the moment, we have the price fluctuating below R1 area and we expect a decline will happen as it used to do in the past and by reaching S1 (which is considered a good point for saving profits), we must wait for some confirmation candles and then our prediction would be a rise to R1 or even higher than that. In case the price loses the support at S1, therefore more decline is predicted.
Warning: This is just a suggestion and we do not guarantee profits. We advise you to analyze the chart before opening any positions.
Wish you luck
