ZILUSDT.P trade ideas

ZILUSDTPERP outlookZilica tried to make Decending BW pattern trend, it bounced fibbonachi level at 0.3 to break the trendline and back to bullish. Let's see.

ZIL/USDT SHORT SETUPSZIL lost it's range which we have been trading for the past 10 days, now trying to find it's feet at lower levels. SHORTs of interest from retest of this previous RANGE LOW or at Current levels.


ZILUSDT | BUY ON BREAKOUTZILUSDT has been in a downtrend after making a top around 0.04962 and trading under the falling resistance. The price took support from horizontal zone and now the price has approached to falling resistance.
We are expecting a breakout above the falling resistance. One can take buy position after breakout and price need to sustained above it.
The bulls need to break above the falling resistance. While bears will be active below the falling resistance.
Trade your levels accordingly.

Zil/USDT Long📈 5min scalpN.B. These lines and levels are for 15min chart only
All conditions met
High risk: Very High rewards
P. S. THIS IS NOT A FINANCIAL ADVICE
IT'S LIKE A TRADING JOURNAL TO ME

ZILUSD ❕ broke up the rangeZIL is at a point of control, and despite the long shadows and liquidity, price continues its upward movement and volumes continue to rise.
Price has broken up the 200MA (1H TF)
Main MAs are bullish (30M TF)
I believe the asset can continue to rise if it fixes above the Point of Control level.

Zilliqa (ZIL) Price Prediction 2022Zilliqa (ZIL) Price Prediction 2022
Zilliqa (ZIL) holds the 82nd position on CoinGecko. ZIL price prediction 2022 is explained below with a daily time frame.
A horizontal channel or sideways trend has the appearance of a rectangle pattern. It consists of at least four contact points. this is because it needs at least two lows to connect, as well as two highs. Buying and selling pressure is equal, and the prevailing direction of price action is sideways. Horizontal channels form in periods of price consolidation. Buying and selling forces are similar in a horizontal channel until a breakout or breakdown occurs.
Currently, Zilliqa (ZIL) is at $0.03729. If the pattern continues, the price of ZIL might reach the resistance level of $0.04960, If the trend reverses, then the price of ZIL may fall to $0.02984
Happy Trading $$$$


short to mid term $ZIL prediction ! 50%+ PossibleZilliqa's chart is quite promising at the moment. It looks like ready for rally. All the conditions are met except the volume . As soon as volume picks up, this can be unstoppable rally! I will update this chart as we move along!

ZIL/USDT Break Symmetrical TriangleHi, Trader. I found something interest in ZIL/USDT
ZIL/USDT on timeframe Daiky shows bullish movement. Sym triangle n done retest. trying to long on breakout area.
What do u think about my setup? Give comment/positive feedback below

ZIL/USDT up, uP, UP AND AWAY WE GO!we are right under 5 cents, should see a nice continuation to the upside.

Zilliqa breaking long-term weekly downtrendZilliqa has been in a long-term downtrend since April 2021, down around 80% at the time of this post (hit almost -90% earlier this year). There is a hard line being drawn in the sand that seems to correlate with pretty major moves in the market. Upon hitting the resistance trend line, there is almost always a move down of 50%, followed by a similar recovery back against the resistance line. This pattern was broken with the news of the Metapolis "launch" in March 2022, Zilliqa's attempt at a metaverse/metaverse-as-a-service (MaaS). After the Metapolis pump, Zilliqa has been under a trendline which can be traced back to the end of the bull run in 2020/2021. This leads me to follow a trend on the RSI...
Since at least 2020, when the RSI breaks above the 14-week SMA we have seen some major moves in volume and price (volume was not present in August 2021 and led to only a ~75% gain). Breaks above this RSI SMA have resulted in moves of 600%, 1200%, 78% (no-volume full-on bear market), and 500%.
With the recent, what seems to be, bottoming action in the market it appears that Zil has found its footing around the $0.04 mark and has been moving up nicely for the past 5 weeks. The price was able to break above the trend line but was quickly rejected. A second move above the trend line has seemed to hold steady as the resistance has now been tested as support, and held, over the past 2 weeks. I believe this could be the beginning of another significant move for Zil.
Some Fib. analysis has Zil looking at the same old areas of resistance in price, $0.08-$0.10, $0.13, $0.15, $0.18, and finally the all time high of $0.24. All signs point up for me from here.
This is not financial advice :)

Very beautiful deep crabI've found the deep crab in Zil. I think it's almost a time to Strong short.

ZIL/USDT - we will see continuationInitial rejection. Getting ready to retest $0.048 confirm as support then $0.05 resistance next.

Zilliqa/USDT getting ready to test $0.05 Zilliqa is ramping up, as long as our green support line remains as support, we should be slowly grinding upwards to $0.05 to conduct our initial test of the 5 cent level.
Zilliqa is a true underrated gem in the market.
Do your own research as this is not financial advice. Good Luck in your trades.

ZIL LONGLong Set Up (Not a Financial Advice/ Trade at your Own Risk)
-Wait for the right time to get in!
-Identify key levels

Zilliqa buying opportunityToday we can witness a nice pullback providing multiple buying opportunities across the board. One of the most interesting options seems to be ZIL/USDT. This is because we can see a consistent bounce off the Fibonacci support. As a result, we expect the next upswing to start within the next 48h.

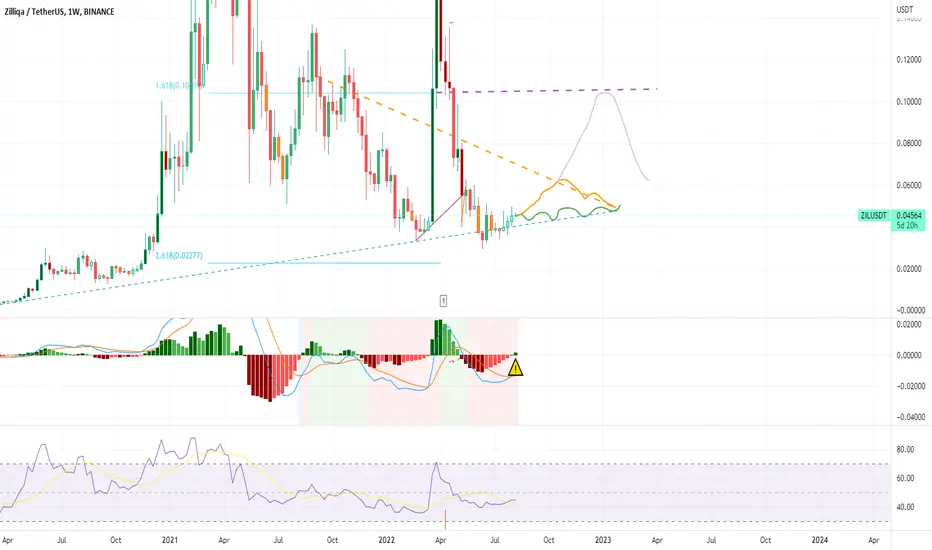
ZIL is tempting to buyfrom my perspective, there are 3 scenarios that I think it possible, the most likely is the green one. and if there is a catalyst from the crypto market it might go on the orange route.
the last route (purple) is the least possible since I think crypto is not ready yet for the next pumping cycle (most likely to be impossible).

$ZIL- updateRetraced back to the breakout area ..
H4 is reset assuming corn goes up this gets sent..
invalidation close below previous range high or the white line
dusk , fet , ren all pretty much similar spots waiting for direction .


$ZIL- shillflip white line can fly to .53 , risk /reward looks nice . might see a 3rd tap on the blue line so watch out for that deviation
above .70 can really go crazy
