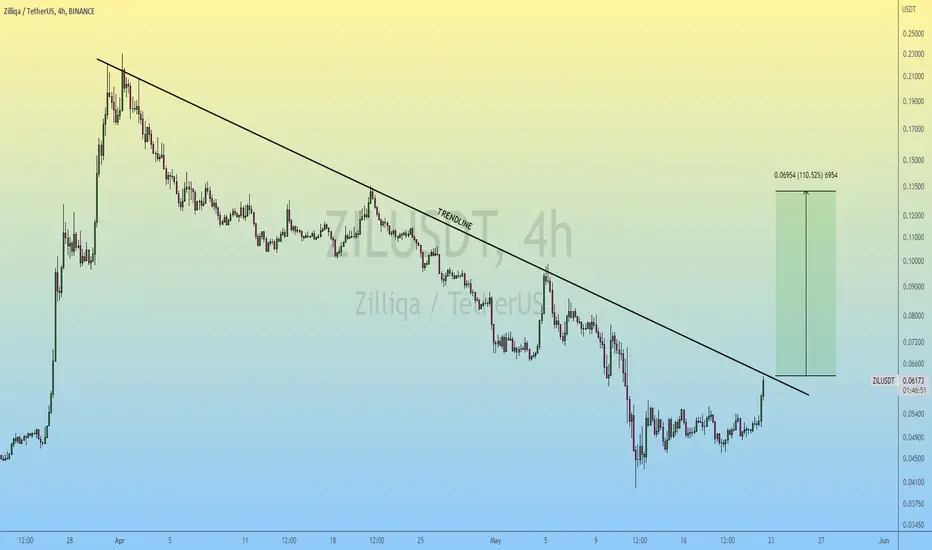
Zilliqa | Ready for Another Breakout..!!
#ZIL (update)
Zilliqa is Going to Test the Major Trendline Again..!!
In case of Breakout, Expecting Massive Bullish Wave.. 🏄♂️
Please like the idea for Support & Subscribe for More ideas like this and share your ideas and charts in Comments Section..!!
Thanks for Your Love & Support..!!
ZILUSDT.P trade ideas

ZILUSDTHello Crypto Lovers,
Mars Signals team wishes you high profits.
This is a 4-hour-time frame analysis for ZILUSDT
You see that the price reached the first support line after having an up and down tend. It could have a rise a little and since May 13, it could keep its constant fluctuation trend. Now it is fluctuating below the first resistance line and has not lost its support. Therefore, we expect more rise for the price by moving over the first resistance line. In case the price moves below the first support line, then it will face more fall.
Warning: This is just a suggestion and we do not guarantee profits. We advise you analyze the chart before opening any position.
Wish you luck

Zilliqa : To where?Zilliqa has still a good chance to recover in the long term.
It's one of the best blockchain projects.
This update is for the small-time
Zilliqa looks to be interesting and for this reason wroth following.
This does not mean that there should be placed orders, but more to see or Zilliqa respect the levels.
0,074 are a target where the focus is.

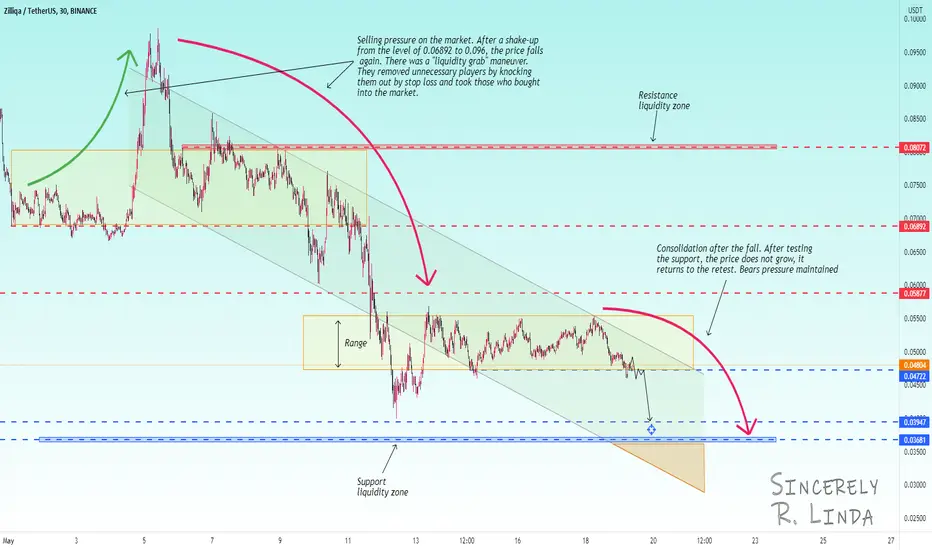
ZILUSD ! The price is getting ready to break through the supportZILUSDT continues to fall. After the price rebounds from the level of 0.03957, the price rolls back and forms a consolidation between 0.055 and 0.0472. The price does not grow, but continues to consolidate and forms a triangle, hinting that the support will be broken.
I assume a breakdown of support 0.04722 after the price finishes pressing to the level. Think,
that we can see a move down to support 0.03947
Sincerely, R. Linda!
$ZIL - Macro Count.Assuming we're done here, and I'm pretty sure we almost are, this is what expect for the next 2 years.
You've probably heard already that 99% of crypto are probably going to zero. And while this might be true, this is probably the only scenario that invalidates this count for Ziliqa.
We've had a beautiful wave 1 push to 0.25$ and I believe (I used fractals here) that if we fib-extend wave 1 to 3, we'll reach 0.70$.
There may still be a tad of downside to this subwave 2, and if the count is invalidated, there isn't much lower it can go, either way.
Safe trades.

ZIL - DON´T MISS ITHey Guys, ZIL break out on the 4h and get on his way to the daily downtrend. If he breakt this too.. woa, nice gains ahead! But be careful with BTC and take always profits :)
NO FINANCIAL ADVICE | DYOR | HAPPY TRADING

ZilIt has received a lot of attention lately, and as usual it has been sold out. Our entry needs a strong impulse, and I don't recommend it at the moment.

Don't miss opportunity for long position hello every one
if you are waiting for a good setup for ZIL entry I think its time to buy
the resistance is the red line and every time ZIL touches this area rises up like a crazy
all you need to know is in the chart
look closely and make your position smartly
this is just my idea and not a financial advice

ZILUSDT◻️ZIL - corrected by 0.7 fib, which means its continued existence.
◻️If you take it apart from the technical side: We have a level, $0.5... Fixing at this level, I don't see it at all. If we go below $0.5 and the daily candle closes below the level, I think we will go to update the low. If there is a consolidation at this level, we can expect a reversal.
◼️At the moment, everything looks weak
🔥Subscribe to my Tradingview profile

ZILUSDT Daily S/R| Swing Low| Price Action| Trend Evening Traders,
Today’s analysis – ZILUSDT- trading in a strong corrective piece of price action, creating a range here at current levels can signal a potential bottom,
Points to consider,
- Price Action Corrective
- Daily S/R Support
- PSFP areas
- Daily S/R Resistance Objective
ZILUSDT’s immediate price action is corrective and is trading towards a daily level that has key previous swing lows, swing failing these lows will be a bullish sign.
The price action can range between the Bearish OB and the Daily S/R Support until the next significant expansion.
The immediate objective is the Daily S/R Resistance, this level current remains untapped.
Overall, in my opinion, ZILUSDT is a valid long with defined risk, price action is to be used upon discretion/management.
Hope this analysis helps
Thank you for following my work
And remember,
“Where you want to be is always in control, never wishing, always trading, and always first and foremost protecting your butt.” – Paul Tudor Jones


CHECK ZILUSDT OUT AND BAG YOUR BAGSHi guys, my name is fatai and this is my analysis on ZIL.
my bias is simple,i am waiting for price to close above the marked area of value after which i am willing to go long.
you can take this as financial advice and make money.
stay tuned to more coin updates


Good times to DCA and accumulate. deployed some capital to scoopAccumulation period. Waiting for FED to make a pivot to bring back stocks and crypto market. For now, I will dca into altcoins that I believed in and ZIL is one of them.

ZILUSDT wants to retest the monthlty support?The price is testing the weekly resistance after a bounce on the monthly support on 0.34% Due the news the price had a bullish impulse.
on the daily timeframe the price lost the previous support as new resistance and now the price is testing it.
on the 4h timeframe, the price is testing the daily and 4h support.
How we can approach it?
The price could have a new rejection from the daily resistance and retest the previous monthly support where the reaction began.
––––
Keep in mind.
🟣 Purple structure -> Monthly structure.
🔴 Red structure -> Weekly structure.
🔵 Blue structure -> Daily structure.
🟡 Yellow structure -> 4h structure.

TS ❕ ZILUSD: reached the supportZIL has reached the support level again. An upward reversal is possible at this point.
BUY scenario: long to 0.082.
----------------------------------------------------------------------------
Remember, there is no place for luck in trading - only strategy!
Thanks for the likes and comments.

ZIL my reviewthe momentum is leaked, it will drop one way or another since the environment does not support.
but overall I'm bullish on this token since it shows strong hold while crashing

ZIL - NICE BREAKOUTHey Guys, I hope you saw the breakout. Unfortunately I didn't have time to share my trade with you. But I will share more of my trades and analysis here in the future. I have a tradesignale company in Germany and last month I made over 3300% profits. Maybe I will also start an english speaking group. For now, feel free to follow me here.
NO FINANCIAL ADVICE | DYOR | HAPPY TRADING


ZILIQUA Extremely Bullish! Outbreak could be imminent Ziliqua appears to be in an extremely impulsive wave cycle which can lead the asset to new high and provides a unique opportunity, the favoured wave count as shown on the chart shows that ZILIQUA can achieve substantial growth in coming month as a possible Micro Wave 2 correction could be complete whereby from the $0.23 Wave 1 high price came down in a 3 wave zig zag (ABC) and then price shot up (+40%) in potentially the genesis of the Micro 3rd wave ending the corrective price action.
We can have some strong conviction of the postulated wave count looking at the impulsive nature of the incline in MICRO Wave 1 and the fractals or subdivisions validating the impulsive wave count as we can see Micro wave 1 is broken into 5 wave impulses on lower degrees. Price also seems to be contained within a bull flag which with Bitcoin potentially reversing soon, Ziliqua could break the bull flag and move towards the key $0.13 which if broken can lead to rapid incline higher ultimately target the 3rd wave advance towards key fib extensions.
With Ziliqua retracing a deep amount in the Micro Wave 2 (80+%) it provides a discounted purchase, with a lot of upside potential.
Stay safe and follow for more Advanced Elliot Wave Applications!!

$ZIL set for a new breakout? #ziliqaZIL has been consolidating in the past few 4h candles: if this consolidation area is broken to the upside and we see a nice breakout from the 0.086 resistance zone, we can place a good long order targeting the following resistance @ 0.10
speaking of confluences, a breakout from the said area would also mean a breakout of 4h 50 EMA (which you can see in light blue) and 1D 50 EMA (which is instead white)
profits would be around 12% but I always suggest to pick your own take profit and stop loss levels
judging from the volume profiles, we can also see the current price area is very strong, thus we can expect some good momentum if it gets broken
anyways, we must also see that we are in a downtrend right now, so be careful guys! trends continue more times than they do not, but I think if we get a breakout we can still have a nice rally
let me know what you think about this and drop a like and a follow if you found this helpful!

keep an eye on ZILLIQAZilliqa might soon break the down trend. Wait for a confirmation signal then enter. good luck.
