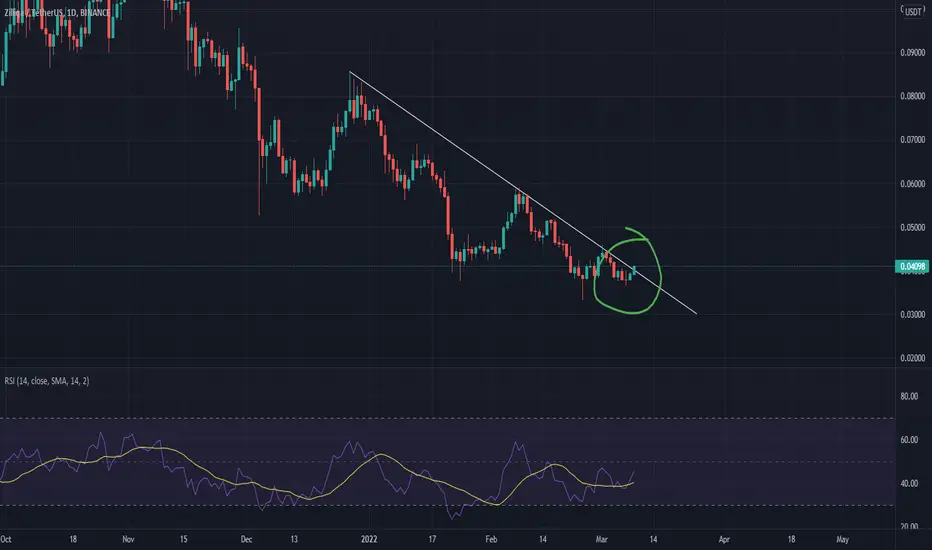
zil about to break downtrendzil is looking great to accumulate down here,
could potentially be close to breaking the down trend
ZILUSDT.P trade ideas

ZIL correction over?ZIL may have finished a three wave (ABC) correction.
Currently looking for up from here.

ZILUSDT, Bullish More ?With power, it was able to break the resistance levels and create a bullish trend. I already specified the support and resistance levels at the chart.
Its not Buy or Sell SIGNAL
DYOR
BY : Mohamad Teriz - @AtonicShark

ZIL is ready to explode ,check this idea before sell your ZILs🤯Hello traders 🐺 .
Before talk about the ZIL , I want to mention that this is a very specific idea about the ZIL and if you are a ZIL holder make sure to read this idea carefully and share this idea among your friends who are actually currently holding ZIL or decided to buy some cheap coin 🚀 .
first I will start with the ZIL/USDT and then I want to look at the ZIL/BTC because ZIL/BTC also have interesting chart and I think it's worthy to specify one part of this idea for it :
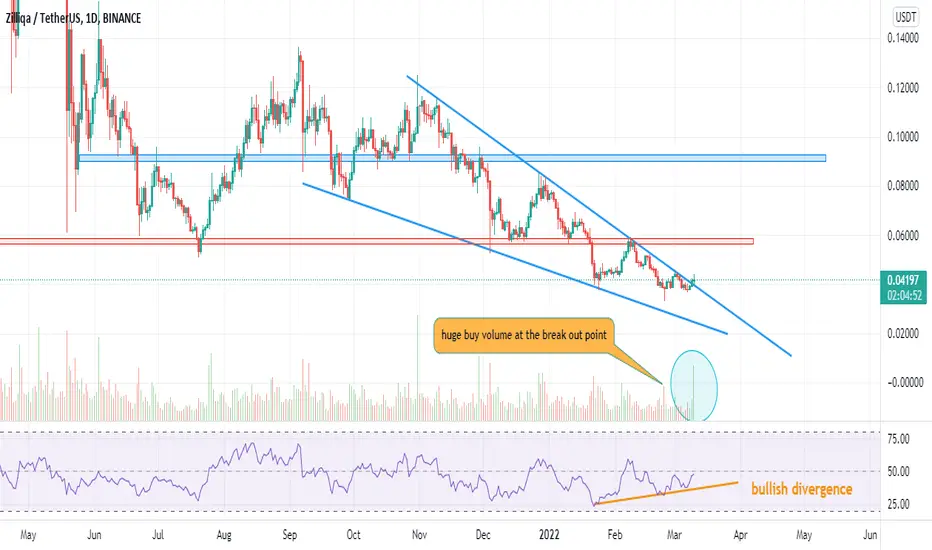
In the chart above we can see that , we have a very clear falling wedge pattern and as you know the wedges pattern usually show us that people are feel boring about the current trend and this is reason why that we can also see a bullish divergence in the RSI value , also if you look more closer to the chart you can defiantly see that the price is now breaking out from the wedge pattern with considerable amount of the volume so we can say that this is a legitimate break out .
Also if you look at the chart you can see that ZIL created a small W pattern and in my opinion the first target is near to weekly resistance structure (red box) and after testing that resistance level we will see a rejection from that level so make sure to take some profit around the weekly structure .
But as you might know the technical target of the falling wedge pattern is the top of the wedge . now it's time to look at the smaller time frame :
in the 4H chart we can see that the price is now testing the previous resistance as a new support , so we can say that here we have volume supported break out and also have a retest of the break out level .
If you draw Fibonacci level you will see that the technical target of the W pattern is in alignment with the weekly resistance structure (red box) so it's make sense for us to take profit around that level .
But now let me to show you the ZIL/BTC chart :
About the ZIL/BTC I don't want to get into the details but I just want to show you that we have the same pattern in the ZIL/BTC chart and also price is already testing the weekly strong support structure , so in my opinion there is good chance for the ZIL to pump from the current level .
Thank you guys for reading my idea , also don't forget to like my ideas and follow me for more support🙏.
ZILLIQA BULLISHAs i said on previous analysis zilliqa broke the the resistance and hit our first target..0.058 next target 0.08-0.11.
Share your idea
If you like it follow me

💡Don't miss the great buy opportunity in ZILUSD @zilliqaTrading suggestion:
". There is a possibility of temporary retracement to the suggested support line (0.05089).
. if so, traders can set orders based on Price Action and expect to reach short-term targets."
Technical analysis:
. ZILUSDT is in an uptrend, and the continuation of the uptrend is expected.
. The price is above the 21-Day WEMA, which acts as a dynamic support.
. The RSI is at 80.
Take Profits:
TP1= @ 0.05901
TP2= @ 0.06308
TP3= @ 0.06913
TP4= @ 0.07442
TP5= @ 0.08520
SL= Break below S2
❤️ If you find this helpful and want more FREE forecasts in TradingView
. . . . . Please show your support back,
. . . . . . . . Hit the 👍 LIKE button,
. . . . . . . . . . Drop some feedback below in the comment!
❤️ Your support is very much 🙏 appreciated!❤️
💎 Want us to help you become a better Forex / Crypto trader?
Now, It's your turn!
Be sure to leave a comment; let us know how you see this opportunity and forecast.
Trade well, ❤️
ForecastCity English Support Team ❤️

💡Don't miss the great buy opportunity in ZILUSD @zilliqaTrading suggestion:
". There is a possibility of temporary retracement to the suggested support line (0.05089).
. if so, traders can set orders based on Price Action and expect to reach short-term targets."
Technical analysis:
. ZILUSDT is in an uptrend, and the continuation of the uptrend is expected.
. The price is above the 21-Day WEMA, which acts as a dynamic support.
. The RSI is at 80.
Take Profits:
TP1= @ 0.05901
TP2= @ 0.06308
TP3= @ 0.06913
TP4= @ 0.07442
TP5= @ 0.08520
SL= Break below S2
❤️ If you find this helpful and want more FREE forecasts in TradingView
. . . . . Please show your support back,
. . . . . . . . Hit the 👍 LIKE button,
. . . . . . . . . . Drop some feedback below in the comment!
❤️ Your support is very much 🙏 appreciated! ❤️
💎 Want us to help you become a better Forex / Crypto trader ?
Now, It's your turn !
Be sure to leave a comment; let us know how you see this opportunity and forecast.
Trade well, ❤️
ForecastCity English Support Team ❤️


SHORT ZIL right now . Dip very possibleZIL /USDT is facing big resistance area it can really fast go down from here. It is now the best place for short it.


ZIL/USDT LongI think ZIL/USDT might form some sort of gartley pattern eventually. If we get carried by the median line, it could provide some good percentage gains. My personal mid to long(er) term target is the previous ATH at $0.2563
On April 2nd Zilliqa will have their Metapolis event in Miami, Florida which I believe will be a big catalyst for positive price action.
#ZIL #ZILLIQA
NFA, DYOR.


ZILLIQA : Interesting trends for daily updateHello trading friends,
This is an update for ZILUSDT depending on daily trends.
0,46+ is an interesting point for Zilliqa to watch out for the increasing trend with the time frame.
Zilliqa shows depending on TA trend interesting trends - and it's possible that we can see coming time a new volume trend - this depend also on the main coin BTC - what should stay at last stable.
Zilliqa could have a 25%+ increase by green trend.
Further, it's important to check also BTC trend - and to manage risk in case Zilliqa did choose another side.
Trend increase can take time - as market going on their way.
Have a great day.
@ This is not a trading call - trade always depending on your setups.

ZIL USDT There is no better looking chart at the moment.
1 morning star at the daily and weekly
2 this reaction happend at the weekly demand zone.
3 correction wxy is done.
Look for lower timeframes for entry.

ZILLIQA BULLISH?Zilliqa is now breaking the chart pattern, if it continues like this we might see a price rall to the indicated 2 targets
Follow for more


ZILUSDTHello Crypto Lovers,
Mars Signals team wishes you high profits.
We are in the daily time frame. The price has had a positive diversion shown by the white line. After being supported at the support zone, the price moved up to the first resistance zone. Now we expect the price to break the first resistance zone and after a pullback, move up to the next resistance zone. If it is not able to break it, it will move down to the support zone. We expect the price to range in-between the support zone and the first resistance zone and then move up to the next resistance zone.
Warning: This is just a suggestion and we do not guarantee profits. We advise you to analyze the chart before opening any positions.
Wish you luck

Bullish Structure for ZILUSDTZILUSDT has been forming falling wedge on the Daily timeframe for awhile.
It has bottomed at 0.03314, which is a resistance area prior previous bullrun turned support.
RSI on daily, 4H timeframe has also formed bullish divergence, with the corrective wave may target back the 0.12 area in the next bullrun.
Notable resistance area will be 0.057, 0.075, and 0.12

Zill Buying Map :PWatch the blue squares! thats where i might be buying ZILL.
Gotta hold those levels. otherwise... rip us :P and rip zill

#ZIL is the key support area.#ZIL is the key support area.
Static resistance was strong at $ 0.048.
#ZIL needs to maintain support at $ 0.038 and break the downtrend line.

ZIL/USDTHello
I see a Head and shoulders bottom....
This formation is simply the inverse of a Head and Shoulders Top and often indicates a change in the trend and market sentiment. The formation is upside down and the volume pattern is different from a Head and Shoulder Top. Prices move up from first low with increase volume up to a level to complete the left shoulder formation and then fall down to a new low. A recovery move follows that is marked by somewhat more volume than seen before to complete the head formation. A corrective reaction on low volume occurs to start formation of the right shoulder and then a sharp move up due to heavier volume again breaks though the neckline.
TARGETS: GREEN LINES
SUPPORTS: RED LINES
