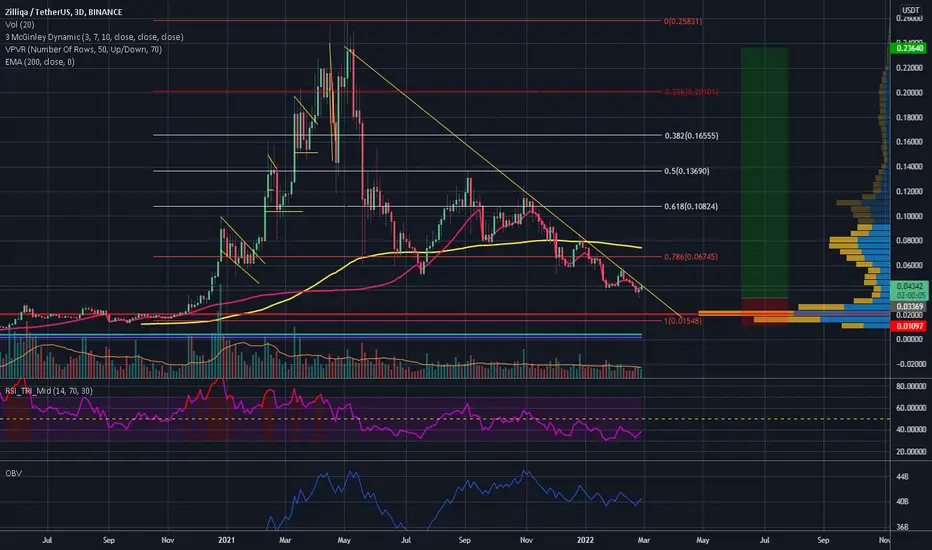
ZIL almost in a perfect accumulation zoneI expect BTC to go down taking the market with it and when this happens (I suppose very soon) ZIL should follow. However I can't miss the fact that ZIL price is very far from its ATH and almost to the 1 Fib line and a potential growth of 600% with little to risk.
My advice is to wait for the next market drop, check where ZIL bottoms and at that point I'd start accumulate up until ZIL doesn't cross EMA 200 upwards. I think this could be a trade with a good profit potential. Moreover the project it's solid.
Recap: don't enter now, check how far does retraces, maybe set some alerts and then start accumulating until ZIL crosses EMA 200. Easy!
Good luck
ZILUSDT.P trade ideas
ZILZIL give H&S breakout and is at resistance line, can buy this coin in two parts (now and correction). Breakout can be big if BTC continue trend.

ZIL WILL EXPLODE!!!!!! This is long term analyse. I Believe in this project more for long term. Do you think we will hit our target at $58?

#ZIL static support was strong.#ZIL Static support in the $ 0.038 range was strong.
Bullish RSI and price divergence.
The key resistance is in the range of $ 0.048.


ZILUSDT long postion Possibilityall you need to know is in the chart
look closely and make your position smartly
this is just my idea and not a financial advise

zilusdt hi, my nickname is Sad. i hope you do not use my analysis as a criterion for buying or selling. i wish you always be profitable. and follow my account.
if stabilized and floored, it has the potential to start a new upward movement.

Zilliqa Reaction To The Current MarketZilliqa has been bouncing on .618 Fib zone after a long while and now its retesting that level once again. Depending on Bitcoin move and the break of 200 SMA, we might see more upside for Zilliqa.

ZilUsdtZilliqa is good project for thsi year but need watch btc first
Zil can move up they have 1 idea for metaverse that name is metapolis i think and so good like Blok but this about 1 city and govermens toke for that is ZIL
this project work adn they can start for this year Zil can pump up
so this so good for save
now on bottom channel and this cannel with reaction prize to middle and top is correct
GL
EntryPoint:
0.04314
Supports:
0.03916
0.03554
0.03097
0.02599
Resistance: (remmebr this resistance is area :
0.04749
0.05015
Targets:
0.05488
0.06169
0.06934
0.08191
0.10126
Mid time : (rememebr this can happen soon with change market)
0.13258
0.15263
0.18682
For HODL:
0.27283
0.35729
0.50346
GL
1 double curve finish
time for blue double curve

ZILUSDTHello Crypto Lovers,
Mars Signals team wishes you high profits.
We are in the daily time frame. The price has broken the S1 line which was previously the resistance. The price can make a pullback to the S1 line and then go up. Or it can go up straight from here. You can buy half of it here and keep the other half at the S1 line in case the price comes down. R1 and R2 areas are good places to save profit.
Warning: This is just a suggestion and we do not guarantee profits. We advise you to analyze the chart before opening any positions.
Wish you luck

AN EXAMPLE ON TRADING "DOWNTREND" USING HEIKEN ASHI + EMAsThis is meant as a note to learn about using simple trend trades using heiken ashi candle and 10/30 EMAs.
Notes:
1. Preferably watch a basic rules of Heiken Ashi Candle shapes.
2. Why Heiken Ashi is used? Less Noise, no reversal pattern, purely identification of trend and EMAs.
3. This demonstration using Zil/USDT is used as an "EXAMPLE" in a downtrend scenarios. (If you want to see how the uptrend works comment below).
4. Please DO your own research before using this strategy as this is not financial advice.

ZILUSDT Going up with Morning StarIn week time period, we have morning star candle. we expect go up to 0.13

Can ZIL break the resistance in JUNE 2022?There is a resistance line for ZIL, if the market is going to recover after this spring, can we see ZIL break the resistance in June as well?
If anything wrong happens and the volume starts to come in, I don't see why not.

#ZIL resistance was 0.056 strong.#ZIL resistance was 0.056 strong.
#ZIL It needs to maintain static support of 0.048.
The #ZIL uptrend line is key support.


5 Key Levels of Resistance for $ZIL These are my 5 key levels to break for Zilliqa to clear the path to new all time highs.
1. Downtrend since Nov. 10th
2. High liquidity zone of resistance
3. Downtrend since Sept. 5th
4. Psychological resistance of $.10 ($.096)
5. High made in Sept. Horizontal Resistance.

ZILUSDT ScenarioBINANCE:ZILUSDT is restricted in a symmetrical triangle. Next supports and resistance are shown in the chart. Breaking out of the triangle shows the next scenario and movement.
Write your comments below

ZIL falling wedgeZil looking good with price forming a bullish falling wedge on the weekly timeframe!

Zill Update!!!Zill still maintains the support at $0.037, bullish will occur and push the price up to the level of $0.06

ZIL/USDT 2 HOURS ANALYSIS Welcome to this quick Update, everyone.
If you are reading my updates for the first time do follow me to get more complex charts in a very simplified way.
I also post altcoin setups on Spot, Margin, and Futures.
I have tried my best to bring the best possible outcome in this chart.
ZIL/USDT is making an ascending triangle pattern.
Entry: CMP or upside the white downer support trendline
Targets 20% TO 30%
Stop Loss: $0.03900
What's your thought on this?
Do hit the like button if you like this update and share your views in the comment section.
Thank you
#PEACE

$ZIL Not all is lostPrice broke through the trend line, which brings negative thoughts. However, there is still a chance for growth, the price touched the bottom bolinger line (last time it happened we saw a 30% growth), if bitcoin does not continue to fall the ZIL has all chances to return to levels above the trend line.
Nearest resistance zone: 0.049-0.059;
Support zone 0.025-0.03;

Awaiting reversalseems like correction coming to its end
maybe one more dip is left. just an idea :_)
