My personal view and predictions on this pairs You see we are still in a down trend but price is gradually rising back to test the 200ma on the 4hrs time frame so we looking long on the 4hrs time frame and take profit should be when price close on the 200ma
ZILUSDT.P trade ideas

ZIL/UsdtZiliqa is now in the buy area with a good stoploss target on the chart.Not financial advice.

ZILUSDT - LONGThere is a long position in ZILUSDT Zilliqa
ZILUSDT Zilliqa
🔵Long Now or set on Key Level 0.06110
🟢Target 1 0.06520
🟢Target 2 0.06800
❌Stop loss 0.05975
#K_Level


ZIL ready to PUMPBINANCE:ZILUSDT
✅Before we start to discuss, I would be glad if you share your opinion on this post's comment section and hit the like button if you enjoyed it.
Thank you.
Possible Targets
➡️We are bounced from fundamental price - bullish
➡️ RSI - tested on D1 few times bottom - bullish
➡️Last time when we was in cold blue mood on market and RSI bottom we make a 155% pump.
➡️ From current price 155% pump will be exactly 0.5 level by FIB
Hope you enjoyed the content I created, You can support with your likes and comments this idea so more people can watch!
✅Disclaimer: Please be aware of the risks involved in trading. This idea was made for educational purposes only not for financial Investment Purposes.
Don't forget sub and join my channels under this idea!

This Will Be Historical Bullish Reversal Of Zilliqa (ZIL)Hi dear friends, hope you are well and welcome to the new trade setup of Ox (ZRX) token.
Formation of huge descending triangle:
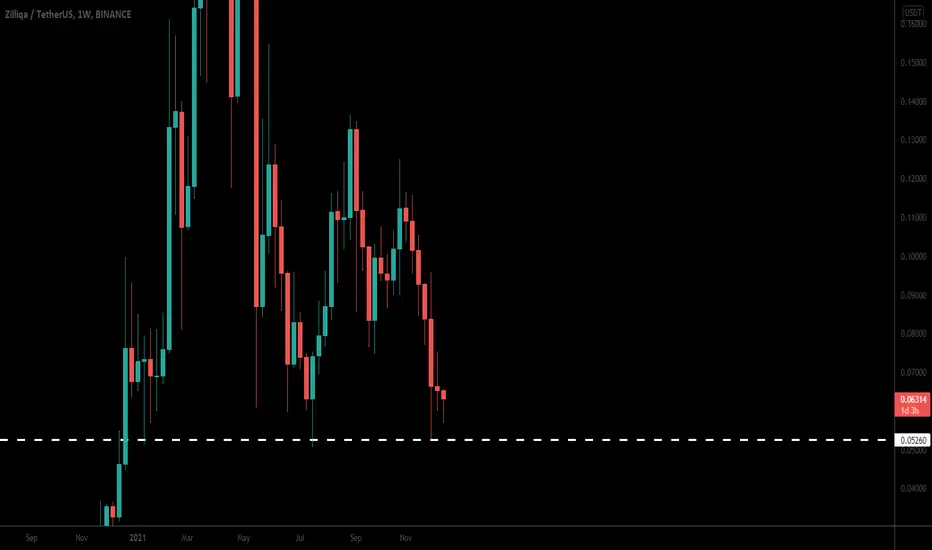
On the weekly time frame, priceline of Zilliqa has found a very strong long-term support at $0.0526. There is also a down trend line resistance above the price action and these support and resistance levels has formed a huge descending triangle.
Huge harmonic move:
On the same weekly time frame the prcie action of Zil has also formed a harmonic bullish reversal Gartley pattern.
After reversal from this pattern, the pricline can also breakout the big triangle as well.
Note: Above idea is for educational purpose only. It is advised to diversify and strictly follow the stop loss, and don't get stuck with trade
Zilliqa formed big Gartley for upto 140.5% rallyHi dear friends, hope you are well and welcome to the new trade setup of Zilliqa (ZIL).
Previously we had a nice trade of ZIL:
Now on a weekly time frame chart, ZIL has formed bullish Garltey move.

ZILUSDT BREAKOUT FROM THE FALLING WEDGEZIL/USDT
Breakout allert, we can wait the retest area after the BREAKOUT
Please do research again
I give you all other sight
May can help you or get another idea from my chart

HODL Long ZILObviously ZIL took a bit hit here. BUT I think we could be seeing some upside soon. Indeed, MacD seems to wanna come green soon, RSI levels are still great for a buy, I see a slight divergence between RSI and price action.
It seems like a huge longer term W double bottom pattern for the big picture and we might see a smaller W formation playing right now. These levels need to hold and we need to come back above MA's.
Also with XCAD and OKI and other projects coming to $ZIL ecosystem, I think a pump is imminent.

ZILUSDT Technical Analysis💎 ZILUSDT has got rejected by the support. It has also has been making HHs and HLs. The price is at a significant support zone. When you see a Bullish setup, you can go long. The price will go to the next major resistance.
🌐 Tradingview
💵 Invest Only 5% of your Portfolio
🎳 Entry/Pullback now or from 0.06583 - 0.06300
☕️ TP1 0.07114
🍺 TP2 0.07670
🍻 TP3 0.08500
🍾 TP4
🍷 TP5
🍸 TP6
🍹 TP7
🎁 TP8
🚫 SL 0.06258 - 0.05950
Good Luck 🎲
Check the Links in Description and if you LIKE this analysis, please support our page and Ideas by hitting the LIKE 👍 button. ❤️ Your Support is really appreciated! ❤️
Traders, if you have your own opinion about it, please write your own in the comment box. We will be glad for this.
Feel free to request any pair/instrument analysis or ask any questions in the comment section below.
We will have more FREE forecasts in TradingView soon
Have a profitable day 😊👍🏻

ZILUSDT (Zilliqa) : 10.DEC.2021 (HODL)Examining the #ZIL , we see that the price has reached a strong support range and is one of the lowest risk cryptocurrencies on the market for investment. I suggest you have a personal review on it for buying and invest and if you already have it, I suggest you to keep it (HODL) .
ZIL Price Live Data
The live Zilliqa price today is $0.067864 USD with a 24-hour trading volume of $60,940,230 USD. We update our ZIL to USD price in real-time. Zilliqa is down 2.99% in the last 24 hours. The current CoinMarketCap ranking is #107, with a live market cap of $822,022,607 USD. It has a circulating supply of 12,112,804,352 ZIL coins and a max. supply of 21,000,000,000 ZIL coins.
Follow our other analysis & Feel free to ask any questions you have, we are here to help.
⚠️ This Analysis will be updated ...
👤 Arman Shaban : @ArmanShabanTrading
📅 10.DEC.2021
⚠️(DYOR)
❤️ If you apperciate my work , Please like and comment , It Keeps me motivated to do better ❤️

ZIL#ZIL
Binance invested in a CENTRALIZED exchange on zil, on the only sidechain in the crypt that runs on local servers at the speed at which it can pull iron.
What will happen to ZIL?

ZILUSDT Technical Analysis💎 ZILUSDT has been making HHs and HLs and has got rejected from the support line. It has also formed a symmetrical triangle. After the breakout we expect the bullish move
🌐 Tradingview
💵 Invest Only 5% of your Portfolio
🎳 Entry/Pullback now or from 0.07231 - 0.06669
☕️ TP1 0.07904
🍺 TP2 0.08546
🍻 TP3 0.09299
🍾 TP4 0.10000
🍷 TP5
🍸 TP6
🍹 TP7
🎁 TP8
🚫 SL 0.06620 - 0.06151
Good Luck 🎲
Check the Links in Description and if you LIKE this analysis, please support our page and Ideas by hitting the LIKE 👍 button. ❤️ Your Support is really appreciated! ❤️
Traders, if you have your own opinion about it, please write your own in the comment box. We will be glad for this.
Feel free to request any pair/instrument analysis or ask any questions in the comment section below.
We will have more FREE forecasts in TradingView soon
Have a profitable day 😊👍🏻

Zil Usdt (good opportunity) As you can see, Zilliqa is on monthly support .and supported with long shadow in daily time frame.
In the picture, I have 2 price channels. And I think in the first stage, the price can reach the top of the first channel
this is not a buy or sell offer

ZILUSDT BullishZIL Update... ZIL going Moon!?
TP 2X, 3X, 4X
BullFlag, Big Triangle & Big Cup & Handle Pattern Breakout...What you think about this Idea? Are you agree with me? Please let me know.
N:B: I'm not your financial adviser.
Thank you


Zil USDT Long!!! Very bullishPlease dont skip this coin. Please buy. I already explain in the chart why you need to buy this.
Potential bullish trend will happen with good fundamentals.
I am just a middle class girl from the Philippines.
3years from trading crypto and forex but not a huge player.
Because of my illness i got tired of doing chart.
For my medication, If you are willing to donate I would be very grateful.
usdt trc20 address:
TTxv2MzmzKBETYPd2rdUkJdJAVjsrD9YBu

Another day, Abother ImpulseJust like the rising wedge , the falling wedge can either be a reversal or continuation signal.
As a reversal signal, it is formed at a bottom of a downtrend, indicating that an uptrend would come next.
As a continuation signal, it is formed during an uptrend, implying that the upward price action would resume. Unlike the rising wedge , the falling wedge is a bullish chart pattern.
In this example, the falling wedge may be predicted as a reversal signal after breaking resistance zone . After a downtrend, the price made lower highs and lower lows.
Notice how the falling trend line connecting the highs is steeper than the trend line connecting the lows.

ZILUSDTIf support stay strong and the market may leave the channel, I see ZIL can go up first to its next resistance zone.
If it will break the support, it may stay in the downtrend channel and could aim for the next support zone or even go lower.
No financial advice.
Corrections are welcome.
Have a nice day!

$ZIL options +-Looking at the current options of $ZIL.
The price actions over the last months was not good. right now we are at the edge of going to 3-4 cents or making a new Higher High and continuing the uptrend.
#Zilliqa #Zillionaire #ZilliqaEcosystem

ZILUSDT is going to test the daily resistance ZILUSDT is going to test the daily resistance. IF the price is going to have a breakout, According to Plancton's strategy (check our Academy ), we can set a nice order
–––––
Follow the Shrimp 🦐
Keep in mind.
🟣 Purple structure -> Monthly structure.
🔴 Red structure -> Weekly structure.
🔵 Blue structure -> Daily structure.
🟡 Yellow structure -> 4h structure.
⚫️ Black structure -> <4h structure.

ZILUSDT CHART TARGET 0.15$ IN DECEMBER 2021
Zilliqa has been quit for some months now, but I think that the end of silence is near.
Look at the performace of Zilliqa after the Black Friday in 2020. It surged 1400% until April 2021.
I think that we will see a similair move from ZIL in this cycle- This might be our last chance to buy in under 0,10$.
My Target are:
0,15$ in December 2021
0,50$ in February 2022
1$ if the madness kicks in April 2022
NFA as usual, enjoy the ride all!
