ZIL/USDT Ready to Get Back its Momentum?👀🚀 ZIL Analysis💎Paradisers, let's take a closer look at #ZILUSDT, as the current market trend suggests a promising opportunity for a bullish recovery from its significant support zone.
💎Examining #Zilliqa's recent market dynamics, we've witnessed a steady 35% decline from its recent peak. Nevertheless, its resilience at the support level of $0.0187 indicates potential for an upward trajectory.
💎Despite obstacles in setting new highs or breaking beyond previous limits, which has contributed to a temporary bearish outlook, the $0.0187 mark remains pivotal for #ZIL. This level stands on the verge of triggering a substantial bullish movement upon another evaluation.
💎As proactive traders, we always have an alternative strategy. If #ZIL weakens at this crucial support and declines further, we're prepared for a bullish resurgence beginning at a secondary support level of $0.016. However, be aware, a breach below this point might herald extended bearish trends.
💎Stay flexible in your trading approaches and vigilant with the market's pulse, Paradisers. Your ParadiseTeam is diligently monitoring, ready to steer you through these market shifts.
ZILUSDT.P trade ideas

#ZILIn the daily time, it is placed in a downward channel, which has shown a reaction to it. Currently, in a short-term ascending channel, the rising wave 3 has finished, and now it has to enter its own wave 5 after finishing the corrective wave 4, which can move up to the specified area. In addition, this movement should not enter the specified range, which will invalidate the analysis.

ZILUSDTZIL looking pretty decent.. Ready for breakout.
Still in the range low, looking for range highs..
NFA.

ZILUSDT"I opened my trade at lower levels and have held onto it until now. If you enter the trade now, it may be a bit risky, but if you enter after the hypothetical line I drew breaks, the risk will be lower."

ZILLIQA ( ZIL ) : New Skill2Earn ModelZilliqa’s New Skill2Earn Model
Since the inception of blockchain gaming, the industry has continued to thrive as gaming projects increasingly adopted the traditional play2earn model, which has offered users the opportunity to create wealth while having fun.
To challenge this widely adopted system, Zilliqa’s new approach to gameplay rewards comes as an effort to revolutionize and transform Web3 gaming and entertainment by introducing a new concept that transcends the usual style of earning rewards for just playing games.
With an emphasis on skills and incentives, Zilliqa expects Skill2Earn to fuel healthy competition among blockchain gamers while allowing them access to a sustainable reward structure.
Instead of focusing solely on playing time, Skill2Earn places more concern on the player’s skill and enjoyment, prioritizing high performance among blockchain gamers.
...................................................................................................................
We are not registered or licensed in any jurisdiction whatsoever to provide investing advice or anything of an advisory or consultancy nature.
and are therefore are unqualified to give investment recommendations.
Always do your own research and consult with a licensed investment professional before investing.

ZIL/USDT If Break this resistance, the price back to upward!💎 ZIL has recently encountered significant market dynamics. Presently, ZIL is confronting a resistance area after experiencing a noteworthy bounce from the demand zone.
💎 If ZIL manages to break above the resistance area and reclaim its price above this level, there's a probability that the price will resume its upward movement and eventually reach our target area, which is the bearish OB area.
💎 However, if ZIL faces rejection at the resistance zone, there's a potential for the price to retreat downward, targeting the demand zone to generate new upward momentum.
💎 The demand area appears to be robust enough to support further downward movement for ZIL. Therefore, the price must bounce upon reaching this area.
💎 Failure to bounce, resulting in a breakdown below the demand zone, could indicate bearish sentiment, potentially leading to further downward movement towards the strong support area.

ZIL/USDT Potential 500%++Potential 500%++
Accumulate under $0.025
Short term targets
TP : $0.0365
TP : $0.0495
TP : $0.0632
TP : $0.0810
Mid term targets
TP : $0.0961
TP : $0.1075
TP : $0.1235
TP : $0.1332
Long term targets
TP : $0.1570
TP : $0.1748
TP : $0.2030
TP : $0.2215

ZIL in accumulation stage and ready for exploding. long and CHILZIL is one of the coins which not exploded yet , RSI is not overbought like many other coins giving space for massive rally on upcoming days ,
keep and eye and DCA from here

#ZILUSDT 6H Chart
Price moved up and liquidated the resistance line before getting rejected. MACD is showing bullish weakness now, RSI is overbought and EMAs are bullish. Price is expected to retest the 6h breaker around $0.22 before potentially moving up again.

ZILUSDTZILUSDT is trading in falling wedge pattern. The price was reacting well the support and resistance of wedge.
Currently the price is about to give breakout from falling wedge and after successful retest of the level will be bullish signal and seems like the price may go for another leg higher.
If the breakout sustain to upside the optimum target could be 0.02400
What you guys think of this idea

ZILUSDT - BULLISH OUTLOOKZILUSDT is exhibiting a bullish divergence on the 1-hour (1H) time frame, accompanied by a breakthrough above the last lower high. This pattern suggests a potential reversal and the initiation of a bullish trend.
Here's a concise technical analysis with a suggested trading strategy:
Entry: Consider entering a long position at the current market price (CMP) of 0.02180.
Stop Loss (SL): Implement a stop loss order at 0.02015 to effectively manage risk.
Take Profit (TP): Set take-profit levels to achieve a 1:1 and 1:2 risk-reward ratio:
TP1 = 0.02345
TP2 = 0.02510
This trading strategy aims to capitalize on the anticipated bullish trend. It's important to monitor the market closely for any changes in price action and be prepared to adjust the strategy accordingly.

ZILUSDT trade set up entriesZIl is trending up. Look to the enter on a pullback at the 0.66 0.616 fib level. Exit at the tp1 2 3. If price close below the red line exit the trade.

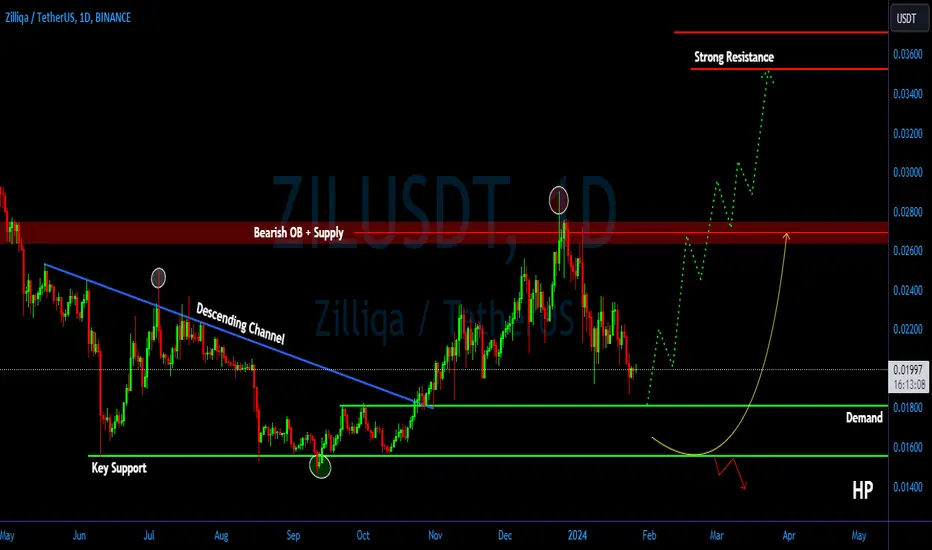
ZIL/USDT Keep an eye on the demand area. Possible Strong Bounce!💎 ZIL has witnessed significant developments in the market.
💎 After experiencing a hard rejection upon hitting the Bearish OB area, ZIL has undergone a 30% drop, with the potential for further decline until reaching the demand area around 0.01815.
💎 A bounce from this demand area could signify a reversal, and if confirmed, ZIL may resume its upward movement, attempting to break out of the Bearish OB area and proceed towards the strong resistance area.
💎 However, if ZIL fails to bounce when reaching the demand area or even breaks down below it, this would be a concerning sign. The price could then continue its downward movement towards the key support area or potentially go even lower.
Turning Traps into Profitable Opportunities ! TOP 3 PATTERNSTrading traps are a common occurrence in the cryptocurrency market. They can be created by a variety of factors, including market manipulation, technical analysis, and psychological biases. While traps can be dangerous for traders who are not prepared, they can also be a source of profit for those who know how to trade them effectively.
In this article, we will discuss three common trading traps and how to trade them profitably. We will also discuss how traps are created and how they can be used to your advantage.
What Are Trading Traps?
Trading traps are false movements in the price of a cryptocurrency that are designed to trick traders into taking a position in the wrong direction. They can be created by a variety of factors, including:
Market manipulation: Market manipulators may create traps to trick traders into taking positions that are in their favor. For example, they may buy a large amount of a cryptocurrency to drive up the price, and then sell it off quickly to create a sell-off.
Technical analysis: Technical analysts may use traps to take advantage of traders who are following technical indicators. For example, they may create a false breakout of a support or resistance level to trigger stop-loss orders.
Psychological biases: Psychological biases, such as fear of missing out (FOMO) and fear of loss (FUD), can also lead traders to fall into traps. For example, a trader who is afraid of missing out on a potential bull run may be more likely to buy into a false breakout.
In the example above, LINK was trading in a horizontal range for several months. The price then broke below the lower range boundary, which was a sign of a potential bear trap. However, the price quickly reversed and re-tested the lower range boundary. This was a good opportunity to enter a long position, as it showed that the trend was still in place.
How to Identify Trading Traps
There are a few things you can look for to help you identify trading traps, including:
Volume: A sudden increase in volume can be a sign that a trap is being set. This is because market manipulators or technical analysts will often need to buy or sell a large amount of cryptocurrency to create a false movement in the price.
Price action: A false breakout or fakeout is often accompanied by a sharp reversal in price action. For example, a false breakout of a support level may be followed by a sharp sell-off.
Technical indicators: Some technical indicators, such as the Bollinger Bands, can help you identify potential traps. For example, the Bollinger Bands may widen before a false breakout, which can be a sign that a trap is being set.
How to Trade Trading Traps
Once you have identified a trap, you can trade it in one of two ways:
Long trap: If you believe that the trend will continue, you can enter a long position on the re-test of the breakout level.
Short trap: If you believe that the trend will reverse, you can enter a short position on
the break of the breakout level.
Examples of Trading Traps
3.1 Triangular Trap Unveiled:
Discuss the bearish implications of descending triangles in technical analysis and their potential use as manipulation tools.
Explore how market manipulators engineer these patterns to trigger artificial stop-losses.
Case Study: NEAR's Triangular Intricacies:
Analyze NEAR's descent within a descending triangle and its unexpected breakout.
Offer insights into the motives behind orchestrating such traps and how traders can leverage these market dynamics.
Here are some examples of how trading traps can be created and traded:
Shakeout trap
A shakeout trap is a false breakout that is designed to trick traders into taking a position in the wrong direction. For example, a cryptocurrency may be trading in a horizontal range for several months. The price then breaks below the lower range boundary, which is a sign of a potential bear trap. However, the price quickly reverses and re-tests the lower range boundary. This is a good opportunity to enter a long position, as it shows that the trend is still in place.
Fakeout trap
A fakeout trap is similar to a shakeout trap, but it occurs after a trend has already begun. For example, a cryptocurrency may be in a bull market. The price then breaks above a resistance level, which is a sign that the bull market is continuing. However, the price quickly reverses and re-tests the resistance level. This is a good opportunity to enter a short position, as it shows that the bull market may be coming to an end.
Reversal trap
A reversal trap is when the trend of a market changes direction. For example, a cryptocurrency may be in a bull market. The price then breaks below a support level, which is a sign that the bull market is ending. However, the price quickly reverses and re-tests the support level. This is a good opportunity to enter a long position, as it shows that the bull market may be resuming.
The Art of Spotting Fakeouts:
Define the concept of fakeouts and unveil their potential as precursors to bullish movements.
Offer insights into distinguishing genuine breakouts from manipulative traps set by
market actors.
Case Study: ZIL's Quick Turnaround:
Uncover the Zilliqa (ZIL) chart, examining the deceptive fakeout beneath a pivotal horizontal level.
Emphasize the strategic importance of waiting for a retest post-fakeout as a confirmation signal.
Conclusion
Trading traps can be a dangerous but profitable part of cryptocurrency trading. By understanding how traps are created and how to identify them, you can increase your chances of trading them successfully.
Additional Tips for Trading Trading Traps
Use stop losses: Stop losses can help you limit your losses if you are wrong about a trade.
Be patient: Do not rush into a trade just because you see a trap. Wait for the

ZILObserving ZIL closely as it fluctuates within a crucial support level. Consider taking a long position if there's a breakout this time, anticipating a potential upward surge towards the 0.034 mark.
Remember, it's crucial to have stop-loss measures in place, practice effective money management, and maintain a maximum leverage of 3x.
Initiate a long trade only upon witnessing a robust breakout at the initial resistance area.


ZIL will be bullish soonIn daily time, we have an obvious diametric.
Now one wave of this diametric is left, the G wave.
The G wave can end at the FLIP range or lower range.
In order to buy in the short term, you should buy in two steps, one step in the FLIP area and one step in the lower area that we have included "BEST ZONE FOR BUY"
For risk management, please don't forget stop loss and capital management
Comment if you have any questions
Thank You

ZIL/USDT bullish momentum from support? 👀🚀ZIL Analysis💎 Paradisers, keep an eye on #ZILUSDT as it currently holds a key support level, presenting a high probability for a bullish movement from this point.
💎 #Zilliqa has recently faced rejection at the $0.02766 supply zone and moved downward. Now, as it regains momentum at the support level, strong maintenance of this momentum could lead to a bullish surge targeting the significant resistance at $0.03600.
💎 However, the ever-changing crypto market requires adaptable strategies. If #ZIL struggles to maintain its momentum at the key support of $0.02444 and begins to weaken, a tactical shift may be necessary.
💎 In such a scenario, our plan B, as astute traders, would be to gear up for a bullish comeback from a lower support level at $0.02224. It's essential to remain alert, as a fall below this level could be indicative of a shift towards a bearish trend. 🌴💰

Zilliqa RetestZilliqa Retesting Trend line breakout, in few weeks bullish rally isndue but if btc moves sideways or stays bullish

ZILUSDT Analysis: Bullish Signals Emerge!ZILUSDT exhibits promising signs of a bullish upswing, with the current price standing at $0.2333. Key indicators support this outlook:
Moving Averages: Convergence of short-term and long-term moving averages signals a potential uptrend, providing a positive outlook for ZILUSDT.
RSI Indicator: The Relative Strength Index (RSI) at its current level suggests that ZILUSDT is not overbought, leaving room for further upward movement.
Volume Surge: Increased trading volume during recent positive price movements adds weight to the bullish scenario, indicating growing market participation.
Chart Patterns: Technical analysis reveals the formation of bullish chart patterns, supporting the potential for an upward surge in ZILUSDT.
Market Sentiment: Positive sentiment in the cryptocurrency community, coupled with fundamental developments, contributes to the overall optimistic outlook for ZILUSDT.

Approaching the 0.786 Fibonacci LevelZil has broken its upward trend in the daily chart and is now declining towards a critical support at the 0.786 Fibonacci level (approximately $0.01853). A fall below the $0.01900, as indicated on the chart, would confirm this downward price movement. The key support level to watch is at the 1.0 Fibonacci daily level.
This analysis is informational, not financial advice.

ZILUSDT 3D#ZIL is moving above the MA100 on 3-days chart. If it keep the MA100, it can go higher to $0.02867 and $0.03696

