ZIL AT 4H RESISTANCEZIL is at 4h resistance and trading with low volume which shows bearish signs
DYOR
SHARE TO YOUR FRIENDS IF YOU LOVE MY CHARTS
FOLLOW ON TWITTER
ZILUSDT trade ideas

#ZILUSDT 6H Chart
Price is ranging in a rising wedge and it recently got heavily rejected off a 12h supply zone around $0.315. MACD is showing bullish weakness, RSI is bought and EMAs are bullish. I expect price to move down from here towards the 12h demand around $0.025 as a short term target. Waiting for confirmation.

ZIL Ascending Triangle Above TRAMAZil/USDT Create Ascending Triangle on Binance 4h Chart pattern above the Trama
Ascending Triangle
The ascending triangle is a bullish formation that usually forms during an uptrend as a continuation pattern. There are instances when ascending triangles form as reversal patterns at the end of a downtrend, but they are typically continuation patterns. Regardless of where they form, ascending triangles are bullish patterns that indicate accumulation.
Because of its shape, the pattern can also be referred to as a right-angle triangle. Two or more equal highs form a horizontal line at the top. Two or more rising troughs form an ascending trend line that converges on the horizontal line as it rises. If both lines were extended right, the ascending trend line could act as the hypotenuse of a right triangle. If a perpendicular line were drawn extending down from the left end of the horizontal line, a right triangle would form.

zil shortclear sign of reversal in the one minute timeframe. One hour time frame shows major rejection at the point of entry. Stop loss should be set and the highest point before rejection and profit take should be at the end of the reject

My ZILUSDT trade plan for short termMy ZILUSDT trade plan for short term. This is not a financial advice.

#ZILUSDT #LQRUSDT #TOBTC #LaqiraProtocol The price is moving in an upward channel and weakness is observed in the upward trend
Support $0.0255
static resistance $0.031 & dynamic resistance EMA200 Daily at price $0.0317

ZILUSDT Failure and departure from compression rangeFailure and departure from compression range
BREACK OUT TRIANGLE PATTERN
STRONG BUY SIGNAL
ZILUSDT| Wave One| Weekly S/R| Daily S/R| Price Action| Trend Evening Traders,
Today’s analysis – ZILUSDT- trading at and area of resistance where a rejection is plausible,
Points to consider,
- Price action corrective
- Weekly S/R Resistance
- Daily S/R Support
- Impulsive Wave
ZIULUSDT’s immediate price action is trading at a resistance point that is in technical confluence with the POC, Weekly S/R, Int Daily S/R and the .618 Fibonacci, allowing for a potential correction.
The immediate support will be the Daily S/R region, price respecting this rea will allow for completion of Wave Two.
Overall, ZILUSDT is a valid long on the pull back, this will allow for a defined entries, invalidation is multiple candle closes below the Daily S/R Support.
Hope this analysis helps,
Thank you for following my work,
And remember,
“It’s not whether you’re right or wrong that’s important, but how much money you make when you’re right and how much you lose when you‘re wrong.” -George Soros

ZIL/USD SHORTZil on 4h charts RSI divergence, Stoch Rsi losing momentum and rejecting of resistance. Expecting to break down the trend line and go down.


model seems to think its more likely longwe retest highs before going down any. Ive ran other models that show a bigger drop first but ultimately we retest the highs.

LONG ZILUSDT ZILUSDT WILL GO .02800 WITHOUT STOP
IN 10× LEVERAGE YOUR WORKING CAPITAL WILL GROW 300% FROM THIS LEVEL
1st target .02572
2nd target. .02750
3rd target .02820

ZILUSDT Analysis - 11 JANUARY 2023Hello Guys, Today's Analysis is on the ZILUSDT Symbol in a 1H Time frame, I Hope it Will be Useful for You, Don't Forget to Like, Follow, Comment


Is it Bulls' Time for ZIL?Looking at the daily chart of ZIL/USDT, the ZIL price was swinging from $0.01541 to $0.03426 within the past 30 days after going to its lowest of the month at $0.01541.
Bouncing back from the support level, ZIL is trading in the previous order block formed on 08 November 2022. If ZIL is able to break out of the order block and rises higher, we can expect ZIL to reach $0.05.
Meanwhile, our long-term ZIL price prediction for 2023 is bullish if it cannot break the support level. We can expect ZIL to reach $0.06 this year.
If ZIL cannot break the $0.03047 resistance 1 level, the bears may seize control and dethrone ZIL to a downtrend stance. In simple terms, the price of ZIL might fall to almost $0.01621, indicating a negative signal from the previous support level.

ZILUSDT TO MOONZILUSDT WILL BLAST SOON
10× LEVERAGE
MINIMUM 5% UP MOVE
U can see my previous idea as well


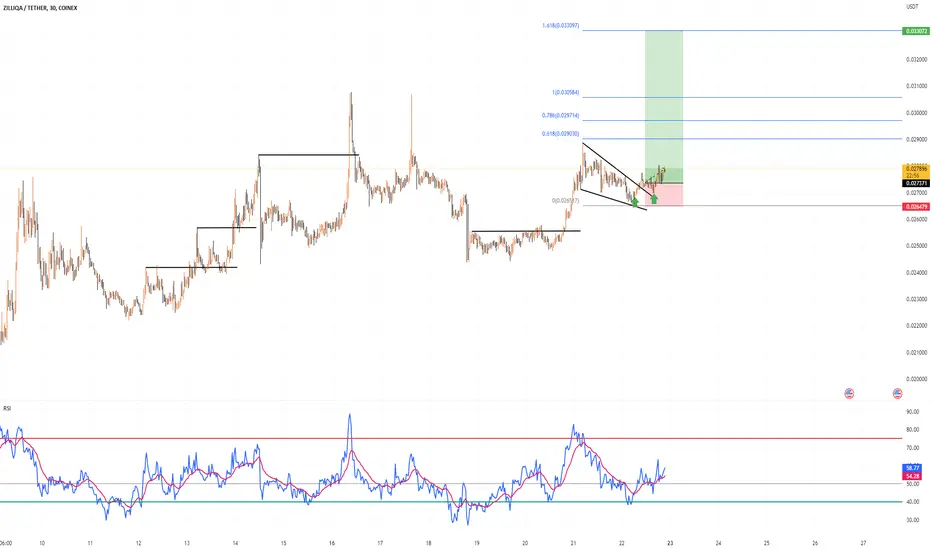
The price has reacted positively to the strong monthly supportZIL has registered a growth of more than 45% in the last 24 hours. The price has reacted positively to the strong monthly support area, confirming the fake breakout of the previous floor support area at $0.020. Therefore, due to this high buyer power, if the daily candle closes strong, pullbacks can create strong positive reactions. One of the resistance levels that can cause many negative reactions is considered in the range of $0.027 to $0.030.
Therefore, considering the high power that can be created at this level, the possibility of forming a range area below this resistance is high. The potential for a trend reversal is built into the daily time frame, and simply making a higher floor that leads to a higher ceiling can help reverse the trend. The bullish candles are in the spike phase on the 4-hour time frame, which, if a pullback is observed, can enter a narrow bullish channel to fully hit the plotted resistance. If ZIL breaks through resistance, it has a high potential for further growth in the long term and very high targets.

ZIL - Potential SHORT - 1hrly (with addition daily resistance) -Trading view post:
Trade Status: ACTIVE
Trader: Drizzzled (AUS)
Trade Type: SHORT
(RE-ENTRY/DCA/LADDER previous entry post
Entry 1: 0.02697 (or any of entry 1 box options)
-if missed focus on next entries. Don’t stress.
Entry 2: 0.02856 “”
Entry 3: 0.03301 “”
Entry 4: 0.03685 “”
Entry 5: 0.04496 “”
Entry 6:
Entry 7:
Stop Loss/ladder re-entries:
Entry 1: slight light above 0.02801 (gann res)
-slightly below your re-entries
-5-10% move from your chosen entry 1
-slightly above/below entry/key resistance
-1:1 or to own personal risk factor
Entry 2: “”
Entry 3: “”
Take Profit Targets:
- 0.01949
- 0.01864
- 0.01766
-
Comments:
-move stop loss to break even once target 1 is hit. DCA entries above/below if stop loss is hit.
-emas will rise/drop with time so shift tp accordingly. If we re-enter higher/lower our same emas become our take profits. Also i have put boxes around key supports which I may choose to take earlier or later profits at too.
-by all means you can long from the daily open to these higher target ‘short’ entries.
-you don’t have to enter at ‘entry 1’ if you would rather enter higher.
-level 1,2 or 3 ,pumps/moves, can go higher and create new levels, hence the re-entries. It’s a shorter time frame strategy.
-don’t hesitate to dm me for guidance :)

ZILUSDT BATBat
The Bat Pattern is a 5-point retracement structure that was discovered by Scott Carney in 2001. It has specific Fibonacci measurements for each point within its structure and it is important to note that D is not a point, but rather a zone in which price is likely to reverse, called the Potential Reversal Zone (PRZ). The B point retracement of the primary XA leg must be less than a 0.618, preferably a 0.50 or 0.382 and the PRZ consists of 3 converging harmonic levels: 1) 0.886 retracement of the primary XA leg, 2) extended AB=CD pattern, usually 1.27 AB=CD and 3) minimum BC projection is 1.618.
The first target would be the 382 retracement of AD and the second target the 618 retracement of AD. A common stop level would be behind the X-point. Conservative traders may look for additional confirmation. Bat Patterns can be bearish and bullish. TradingView has a smart XABCD Pattern drawing tool that allows users to visually identify 5-point reversal structures on a chart.
Likes and comments if you have questions! 🍌
Thanks!

Fast long on ZILFast long on ZILUSDT. Truing buy to second low level. I hope that it will be tested and then go up with brake up level of this small flat channel. Will see...
