ZILVery simple ... Very clear!
Everything is marked on the chart.
This is my personal opinion. Please do not trade based on my analysis and data.
ZILUSDT trade ideas

ZIL ZIL looks so good it needs only wave % of C after that i am expecting to hit T1 at least
it is 1D frame so it takes time maybe 6-14 months or less
peace :)

ZILUSDT Long termZILUSDT: Long term
The price is trading below large volumes, most likely we will see a further price decline
Support around 0.01694-0.00747
If you like the idea, don't forget to subscribe and rate like👍


zil/usdtThis page is made solely for displaying price information and the status of the projects in the market, and does not mean investment or approval of the project

💁♂️ ZIL/USDT _ 12H 💁♂️ HI Everyone
As you can see, the price is fluctuating in the specified box.
If the price can penetrate above the 0.02360 range, the possibility of price growth up to the 0.02490 range can be considered.💹
Support range 0.02226/0.02120 ‼⚠
The range of resistances is 0.02490/0.027❗
❎ (DYOR)...⚠⚜
WHAT DO YOU THINK ABOUT THIS ANALYSIS? I will be glad to know your idea 🙂✌
IF you like my analysis please LIKE and comment 🙏✌

ZIL;;;Short-Mid term Possibilities>>>>Hello everyOne
I Have Tried My Best to Bring the best Possible outcome in this Chart.
Based on (price action's/supply&demand/trendanalyze/technical pattern's)
For prove this scenario,We have some time's yet,
If happen like this pattern',it seems good oppurtunities for long trade setup >>>
But We can buy into each possibilities correction.for mid term.
All important resistance and support's zone (short-mid term) marked on the chart.
This is not financial advise.
PLZ DYOR
With hopping success>>>>>>>>>>>>

#ZILUSDT 2H Chart
Price reached the 2h supply sone at $0.0235 where it got heavily rejected from. MACD is not clear, RSI is bought and EMAs are turning bullish. I expect price to move down and liquidate the support line reaching the 2h demand at $0.02.

Good price for ZILThe current market gave us a good entry point for ZIL.
Why is it?
1.
Zil is a blockchain for casino, betting and gambling intudsry.
Zil develops web3 games
Zil announced own web3 console (physical product BTW). And showed prototype.
I expect release of console and growing token price to more than 1$.

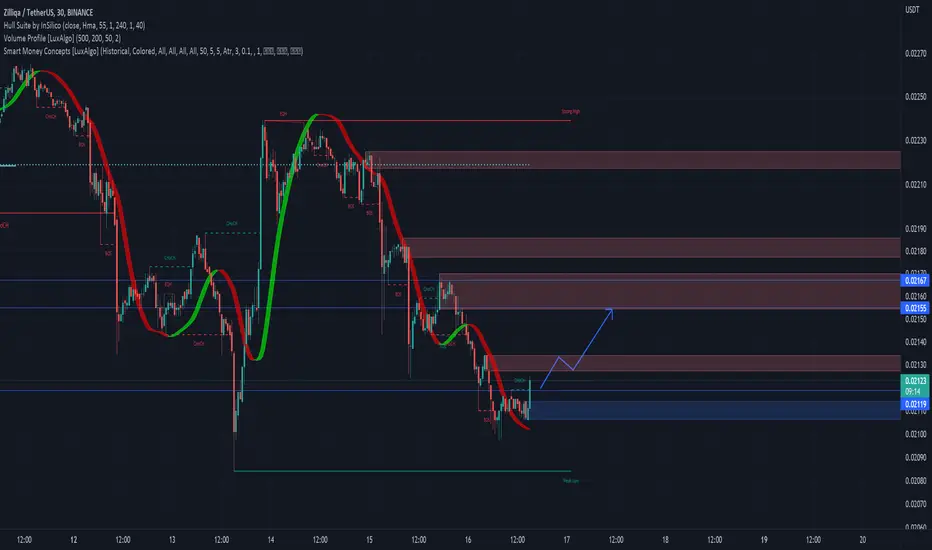
ZIL is more liquidity to the downside!We should have add 1 ATR above our swing high in our previous trade if you could go back to the recent analysis. Now, ZIL is getting more liquidity with a beautiful rejection testing the previous high.
(Not a financial advice)

“ZIL” IS GOING BY THE STRUCTURE DOWN!After seeing a loss os momentum on the 4H timeframe, we can see on the 1H a break of the low creating lower-low and its being retested now. The target as we can see on the 4H is giving us almost 1 to 4 risk to reward ratio. It’s better to use trailing stop-loss.
“None of these are a financial advise, is for education only”

ZIL!! Strong Volatility Happening! If we see a nice breakout this could have a very nice and clear profit targets! Even though we are in a bear market overall, we have to aim for small targets as anything could happen with BTC consolidating at this point.

ZILUSDT Testing Support and Into A New ATH After Correction EndsZIL Uptrend Looks Decent, Currently Testing Support levels and waiting for the correction to end so we can Resume our way to the Top, No Solid Trend penetration till this moment, It's Possible to break the trend line, an update is coming after a technical sign shows up, Till now we are eligible to enter the trade.
Trade Infos>>>>>
Entrance Candle: Bullish Harami ( Reversal Of Bear Price )
Trade Type: Swing
Average Time: 1 - 2 Months
Wallet % : 10%
Entry Area: 0.185 - 0.16
TP: New All Time High ( 0.28 )
Estimated Profit: Average 70%
...............
Notices: 1- Sticking to instructions is better for maximizing profits.
2- check the trade type and average time... If you are not patient ignore this trade.
3- Stop Loss isn't required since we are in a bull run and Targets will be reached eventually.
4- If you are willing to take the trade with more than 10% of your wallet .. do so at your own risk ( mentioned Percentages are recommended ).
5- This is not a Self-Biased thought... it's an Analysis based idea.

Trading opportunity for ZILUSDTBased on technical factors there is a Long position in :
📊 ZILUSDT
🔵 Long Now 0.02117
🧯 Stop loss 0.01856
🏹 Target 1 0.02455
🏹 Target 2 0.02900
🏹 Target 3 0.03530
💸RISK : 1%
We hope it is profitable for you ❤️
Please support our activity with your likes👍 and comments📝

ZILZIL is bullish for long term in Weekly frame
C needs couple more weeks to get it just be patient
also it has a positive divergence in RSI as well
good accumulation area in that box
peace :)

Zil going to moon?hey hey,
ZIL/USD looking awesome daily below the SARS, like many of alts, but this one might be top 5 performers in coming month,
lets see
de


ZIL/USDT - LONG ----- Welcome, dear followers! -----
- Here is my trading methodology. I trade with a normal system and analysis of resistance and support, as well as price reversal patterns.
- For the record, I do not place a stop loss within my trades. So that I only risk 1.5% of my total capital in order to support the loss due to a price reversal against me.
- If a price reversed against my expectation and touched the drawn line r3, then I transferred targets to the entry point and waited for the price to close at it with a loss equal to almost zero.
- Today's deal is shown in the chart, and here are the entry and exit points below.
-- Support me with numbers and follow up on my account for other deals in the future. Thank you for coming to this part.
---------------------------------------------------------
⚡️⚡️ #ZIL/USDT ⚡️⚡️
Client: My-Binance Futures
Trade Type: regular (Long)
Leverage: Cross (2X)
Entry Zone:
0.03199 - 0.02976
Take-Profit Targets:
1) 0.03253 - 25.0%
2) 0.03416 - 25.0%
3) 0.03584 - 25.0%
4) 0.03774 - 25.0%
Stop Targets:
1) 0.02907 - 100.0%
Trailing Configuration:
Entry: Percentage (0.5%)
Take-Profit: Percentage (0.5%)
Stop: Breakeven -
Trigger: Target (1)

The possibility of ZIL price correctionPrice previously tapped into the 6h demand zone at $0.0293 before moving up from there. I expect it to retrace towards the 2h demand at $0.0308 then continue moving up from there

#ZILUSDT (Watchlist) 11/22#ZIL maybe worth it to add this coin to your Watchlist. 👀
(Share it with your friends)
Remember Alts totally rekt during the bearish cycle and they always do -92 -95 -99% so make sure to follow risk management.
#DYOR
Everything mentioned on the chart (Pattern/Resistance/Support / Breakout/Breadkwon levels, Also R: R)
add to the watchlist means the coin we mentioned is forming a pattern or moving near a historical bottom, around or above good support, increase in trading volume , showing a reversal candle, accumulation stage, etc, but no reaction from bulls, so we inform you to add it to your watchlist until the right time for entry.!!
Ps:
we avoid trading any coin if the entire project is based on gambling, prostitution, human trafficking, borrowing, lending, etc.
This is not financial advice, The purpose of these Charts is to give you an idea about coin movement (not buy or sell signal) so before following any idea be sure to make your own research and follow risk management.
Whatever Don't forget that." Be bullish or bearish as you want, But be sure you cannot impose your opinion or force it to happen. so be ready for everything"
We are responsible for what we write, not for what you understand, so take care and read it carefully to understand it clearly.
The Cryptocurrency market is very volatile and involves gains and losses, so know very well what you are heading toward before engaging in it.
The information we mentioned here is a personal effort so it subject to success or failure.
Good luck to All.
🙏we ask Allah reconcile and repay🙏

ZIL BULLISH Wait for the breakout from this Falling Wedge formation around 0.035 then it will be sent to 0.06794 which is the take profit zone.

ZILUSDT - SET UPZILUSDT price action is in bearish trend for quite a while and made double bottom. Now if the trend breaks we can see it hitting the upside resistance levels.
