zilusdtwe keeping an eye on ZILUSDT, waiting to see where the daily candle close and will have a better picture if we going long or short. stay put
ZILUSDT trade ideas

ZIL LONG Macro AnalysisZIL/USDT 1 week analysis. we have two drives of bullish divergence off this bottom. Last time ZIL showed these signs it went 6300% over 409days

level to level plays for zilliqa - bull and bear scenariosbreak trendline and hold below - short
break trendline and hold above - long

ZIL/USDT Potential Short SetupHello Traders!
ZIL continues to move within the descending channel.
The price is near the support level of $0.0330. Based on the nature of the price development, we can assume the exit of the price to the center of the channel - resistance level of $0.0580 with the purpose of collecting liquidity, after which the downward movement will continue.
Completion of such movement will be the price exit into the range of $0.0150-$0.0210 after the breakdown of the support level of $0.0330.
It's possible to look for medium-term purchases near the support level of $0.0150 in the price range of $0.0150 - $0.0210.
The targets will be the price levels of $0.0580 and $0.0845
Good luck and watch out for the market
P.S. This is an educational analysis that shall not be considered financial advice

ZIL Daily_T Analyze>>>>>>>>>>>Hello EveryOne
I Have Tried My Best to Bring the best Possible outcome in this Chart.
Based on the support price frome exe demand zone,
In the next time,if ZIL can success to break blue line as a resistance in shorter time frame,
price can keep rising to orange's resistance area,
that we can considered as a our TP's.
This is not financial advise.
PLZ DYOR
With hopping success>>>>>>>

#ZILUSDT 6H Chart
Price is still in a consolidation zone with no major movements. MACD is not clear, RSI and EMAs are neutral. We shall wait for the breakout for more confirmation but overall i expect price to move all the way up towards the equal highs at $0.051.

Trading opportunity for ZILUSDTBased on technical factors there is a long position in :
📊 ZILUSDT
🔵 Long Now 0.3910
🧯 Stop loss 0.03434
🏹 Target 1 0.04444
🏹 Target 2 0.05100
🏹 Target 3 0.05990
💸Capital : 1%
We hope it is profitable for you ❤️
Please support our activity with your likes👍 and comments📝

ZIL butterfly pattern#ZIL/USDT
$ZIL can shape butterfly pattern if price hold the support zone above 0.786 fib level of last swing high.


ZILUSDT - Long Idea💡💡#SIGNAL 💡💡
ZIL / USDT
Another deal with a condition. Open only when closing 4h above the red block.
▶️ Buy close price+Block (blue)
🔴 SLT - 4h (Trigger)
#ZILUSDT_4h_300622

ZIL predictionZIL now oversold, which is we need to see if divergence appear to confirm price go up to resistance

ZILUSDT ! Impulse up and falsebreaout of resistance 😼ZILUSDT shows on the chart a possible trend change in the medium term. But this morning the Senya is testing the resistance at 0.04722 with a false breakout and forming the price fixing under this level.
The global trend remains bearish at the moment and there is a good chance that the decline will continue.
I suppose that the price after such an increase can roll back along the global trend. Short-term target - support 0.04000
Sincerely, R. Linda!

ZILLIQA (ZILUSDT) the last chance (bottom) and the range market Hello 🐋
Based on the chart, the price is close to the major support (bottom) or better to say the previous zone that started its amazing pump to the upside ✔️
we
expect to see gain besides the range market is an acceptable scenario too 📖💡🚀
and
if the price breaks the rang area to the upside, we will see more gain 🚀
Please, feel free to share your point of view, write it in the comments below, thanks 🐋

ZILUSDTHello Crypto Lovers,
Mars Signals team wishes you high profits.
This is a one-day-time frame analysis for ZILUSDT
Based on our last analysis on June 22, we predicted a rising trend for the price and now you see that it has happened and then the price faced a decline. In this chart, there is R2 area which used to be a support area and the support of the price is clear at some points. R1 is another resistance area and the unsuccessful triumphs of the price to rise is seen on this line. And S1 is a support areas and expresses the well support of the price at some points. Now we have the price fluctuating below R1 and we believe it will rise to R1 and at this point we will consider a short position for it. After that, we expect a decline toward S1 for the price. If the price rises over R1, it may have a fixation and then move toward R2. Also, it is possible for the price to lose the support at this area and start a decline.
Warning: This is just a suggestion and we do not guarantee profits. We advise you to analyze the chart before opening any positions.
Wish you luck


zil shortthis analyze is based on fibonacci and ftr zones
the sl is has to be that much cuz it playes a lot !

Zilliqa outlook for the long termMarket come in cycles and Zilliqa is going to trade sideways for a period of time which is known as the accumulation period. This scenario fixed nicely into the current macro outlook which is generally bearish and it does not matter if altcoins are going to dip once more because bottom prices are more or less established if you are planning to DCA and hold long term. Zilliqa fundamentally is still quite strong as this project is still hiring people and has constant project development into their Metaverse and gaming projects which shows they are running on a good cashflow to survive through the bear market.
This should give us a good rally into a price range of about 0.35 to 0.4 above after the bear market.

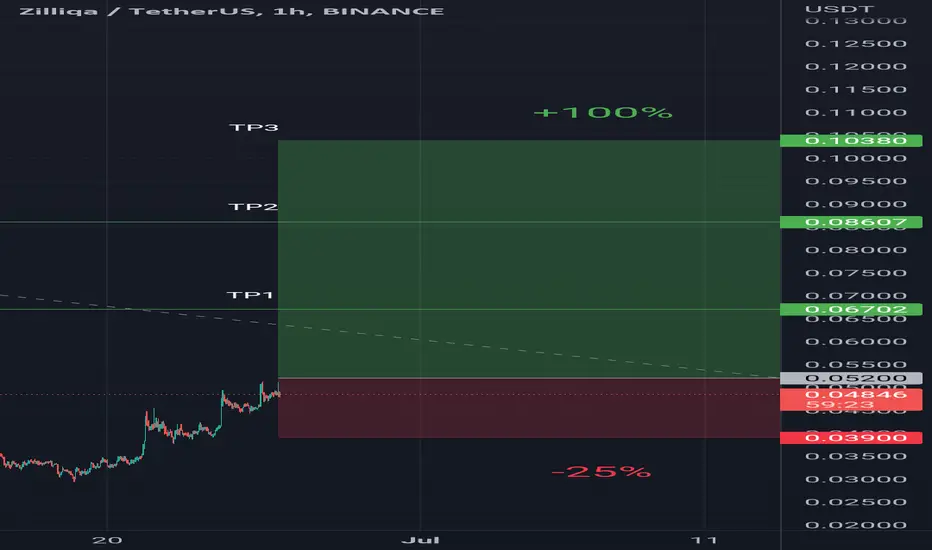
ZIL🔵leverage -----> ×5
___________________________________
🔴Stop Loss ------» 0.039
⚪Entry price -----» 0.052
___________________________________
🟢targets
TP1 -------> 🟢
TP2 -------> 🟢
TP3 -------> 🟢
---------------------------------------------------------
risk rate (+4:1-)
⚜️ Good luck everyone ⚜️
ZILUSDT | Wave Projection|Downtrend Breakout Entry@Retest SMA50?Price action and chart pattern trading
> Elliott Wave downtrend channel breakout testing SMA50 key resistance
> High possibility breakout key resistance and retest SMA50
> Entry @ SMA50 retest - Target SMA200 + 30-35%
> Stoploss @ SMA20 -10 - 15% downside RRR: 2:1
Indicator:
> BBD continued uptrend positive banker fundflow above baseline
> KDJ stochastic strong uptrend ribbon
> Banker smart money volume support
Always trade with affordable risk and respect your stoploss

Short ZILZIL lost its wickless weekly trendline and retested this level. Being rejected, along with the weakness of BTC, ZIL will go down the next days.

✅TS ❕ ZILUSD: reached the level✅✅ZIL reached the level, made a false breakdown and rolled back down. I expect the fall to continue.✅
🚀 SELL scenario: short to 0.0418.🚀
----------------------------------------------------------------------------
Remember, there is no place for luck in trading - only strategy!
Thanks for the likes and comments.

Zilliqa (ZIL) price movement predictionPrice Prediction
not financial advice
this is for entertainment purposes only
always DYOR

ZILUSDT is starting a bull runAfter a declining phase ZILUSDT is now ready for a bull run. The entry point should be at 45 and Stop loss should be at 40
