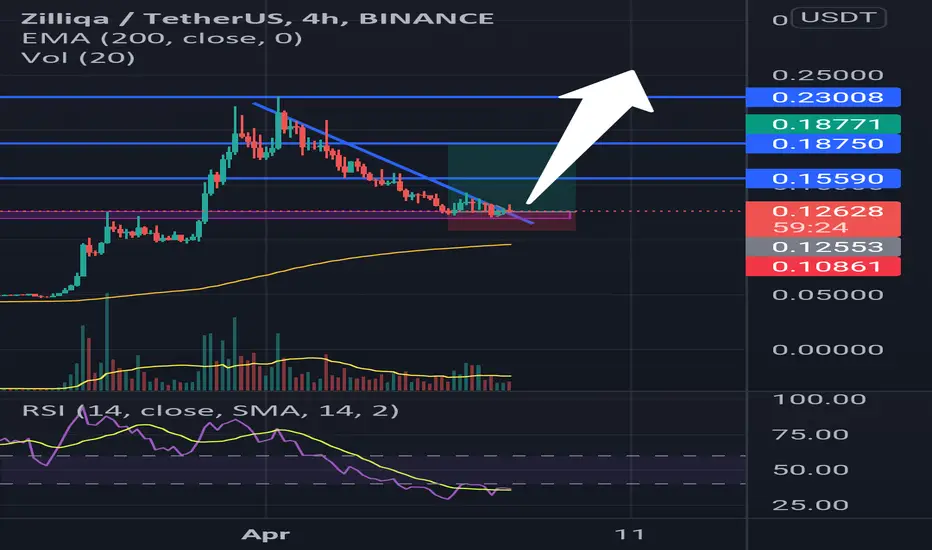
$ZILUSDT CHART ANALYSISBUY ZONE:
0.118-0.12
TP:
0.1420
0.1600
0.1722
0.2231
You will thank me later.
ZILUSDT trade ideas

ZILUSDT LONG POSITION ZIL in down trend and now in strong support area if price break 0.12478 level last top probably the price targeting the mention level
best entry after retest the level to avoid the fake breakout , good luck

Zil Spot Trade - Upto 250% Profit in 30-45 DaysSignal ID 0013
ZILUSDT Spot Trade
Entry 1 @ 0.11
Entry 2 @ 0.075
Tp 1 @ 0.32
TP 2 @ 0.38
Upto 250% Profit
Expected Time frame Mid to Late April
Always save funds for the entry 2
The tps can take longer if btc goes bearish again
The tp 2 has been calculated based off multiple assumptions, it may change over the time as the waves unfold. i will update accordingly

ZIL above middle line of channel#ZIL/USDT
$ZIL is at weekly parallel channel.
resistance zone between 0.5 and 0.618 fib levels of whole swing down rejected the price but price still have the support of middle line of channel.
🐮 holding the support of middle line can increase and even pump price to break out from channel to reach 1.414 fib level and more.
🐻 break down from middle line can drop price to lower line of channel around $0.025

ZILUSDT SHORTThis is my idea
I think ZIL break support zone at 0.12000
i expect ZIL can go lower till Green BOX at 0.10300 ~ 0.10500 . and then just wait for indication from candlestick.
to flip order to LONG position.

ZIL/USDT Bullish SetupHey Colleagues,
Today we came across ZIL/USDT. We see a great opportunity for this coin to show some bullish candles in couple of days.
We sow that on 9th of April it failed to break its strong support at around $0.11 and bounced back up.
Our expectations are that if it tries to test that support line again and fails, then that would be another confirmation for bullish charts. We are buying this coin from 0.12-0.11
If you like ideas provided by our team you can show us your support by liking and commenting.
Yours Sincerely,
Tournesol Team
Disclamer:
We are not financial advisors. The content that we share on this website are for educational purposes and are our own personal opinions.


$ZIL Zilliqa could flatten out between 11c and 10c or down to 4clooks like Zil Zilliqa could flatten out inbetween .11c and .10c ranges for a little bit. It all depends on $BTC Bitcoin and $DXY USD as well. USD has seemed to be rather strong for a little while and climbed up to 100 while Bitcoin has dropped and Zilliqa follwed suit. However it looks like this could be an accumilation slash support zone? Only time will tell.


ZILUSDT - POSSIBLE SCENARIODescending Trendline
First Possible Scenario: It may break the line upward and bounce back around 0.16 levels.
Second Possible Scenario: It may break the line downward and get sideways.
The Two major support levels are
0.11500
0.09702

ZIL/USDT (Zilliqa) - Bullish Double-Bottom Support, Momentum 4HRZIL/usdt (Zilliqa) crypto price has double bottomed above 0.1220 in the 4-hour chart.
Bullish momentum has also formed on the MACD indicator (4hr).
Entry (long): $0.1324
Take Profit +18% (exit: $0.1564
Stop Loss -9% (exit): $0.1204
Note: Zilliqa price may pullback down intraday (shorter-term time frames) before this 4-hour setup rallies up.
Support needs to hold above 0.1200 or this chart setup could be stopped out.
Resistance needs to break and hold above 0.1350 to validate the pattern and potential rally.
All content is Not financial advice. Trade at your own risk.

ZILLIQA , ZIL/USDTI think we have bullish triple bottom pattern. We might see a reversal in the price action of zilliqa, hoping the bitcoin stays positive.

Where does ZiL Zilliqa go 15c or 11c ?Where does this formation take us? On one hand could take us to 15c? Or on the other hand could it take us to 11c if it takes us to 11 range we could see 10c and even 4c however there was an appearance of upwards movement as long as that wedge doesn't collapse? 🤔🤞🤷♂️ NFA

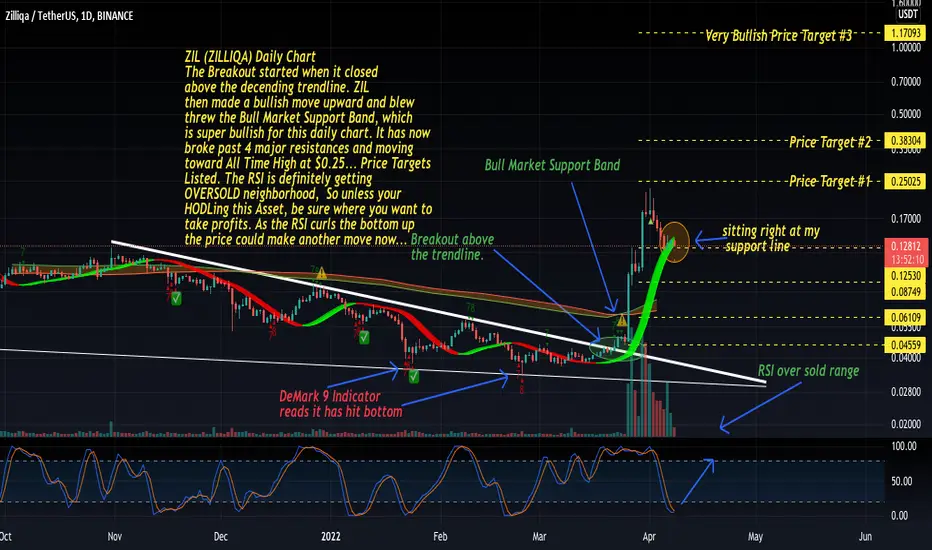
ZIL daily chart has cooled off & could make another push upwardZIL (ZILLIQA) Daily Chart
The Breakout started when it closed
above the decending trendline. ZIL
then made a bullish move upward and blew
threw the Bull Market Support Band, which
is super bullish for this daily chart. It has now
broke past 4 major resistances and moving
toward All Time High at $0.25... Price Targets
Listed. The RSI is definitely getting
OVERSOLD neighborhood, So unless your
HODLing this Asset, be sure where you want to
take profits. As the RSI curls the bottom up
the price could make another move now...
ZILUSDTHi guys,
Forgive me for being a few days late,
according to the volume data and chart, the trading volume is decreasing to $1,000,000,000( -%48 )
and we most wait for now.
__________________________________________________________________________________________
like and share PLZ

ZILZIL Long Idea
ZIL forming a double pattern on 4hr timeframe, possible bullish reversal in trend. Double bottom patern confirmaiton on break above the neckline or breakout candle close above neckline. Also possible breakout from falling wedge pattern.
Wait for confirmation.


Zil updated to continue the journey soonZill following our signal last month posted when it is on the bottom
Now this is an update version, as I see confirmed Bull Flag and nice correction it did already 48%
It is ready for another jump as one of the first movers in every cycle. I assume it help us also on showing where the Bitcoin is going too a long with the previous DGB chart posted a month ago.
Everything showing me that Alt season for 2022 will be one the biggest alt season in history. Soon I assume from May to July we will witness a big jump. Exit on end of July. And rebuy on November for a final blow-off phase Dec2022 to Feb 2023

ZIL Breakout???We could be having a bit of a breakout for ZIL right now.
Going to be some heavy resistance coming most likely though, right around ~T0.135 - T0.1375


Long with zil huge profitZil is holdi support as u can see in chart and also try to brake the important tread line.we can aspect a uptrend in zil.