ZIL swing long
Looks like it's in a bullish consolidation above ema 50
So SL below it is good for safety if you long it
Tp at ema 200 is nice
Just note that above ema 200 there's a big fvg so price needs to either explode ema 200 or consolidate above and the bounce on it for a massive pump
If it rejects it then tp near 200 is safer
Educational purpose only
Nfa
ZILUSDT trade ideas

ZILUSDT Market Analysis: Bullish Breakout or Not?💎 Yello, Paradisers! Let's zoom in on ZILUSDT as it shows an exciting setup at its resistance point, hinting at a possible bullish breakout from the Bullish Order Block (OB).
💎 Zilliqa has been adhering to a descending trendline but has recently made a significant upward break from this channel. There's a strong likelihood that ZIL will aim for higher liquidity in the supply zone.
💎 Further bolstering the bullish case is ZIL's continued robust performance above the EMA100, reinforcing the positive outlook.
💎 However, caution is key for traders: a dip below the 0.200 mark could be an indicator of a shift towards bearish conditions. It’s crucial to monitor these movements closely and plan your strategies wisely.
💎 Elevate your trading strategies for Zilliqa with insights from ParadiseFamilyVIP. Engage with our in-depth analyses on ZIL and other promising tokens to sharpen your cryptocurrency trading skills. 🌴💰

ZIL/USDT Perfect bounce from the demand area. Continue Upward ??💎 ZIL has undeniably captured significant attention in the market. It perfectly bounced from the demand area with a bullish candle rejection followed by a strong green candle. If BTC is supported with a consolidation movement over the weekend, ZIL is poised for significant upward movement, approaching the resistance level area and potentially breaking out. A successful breakout from the resistance level area, probability could lead to an easy movement for ZIL to reach our target area.
💎 However, if ZIL encounters resistance and consolidates in that area, there's a possibility of a retracement, with ZIL retracing back to test the demand area to build new momentum.
💎 The unfavorable scenario is confirmed if, during the retesting phase at the demand area, ZIL fails to maintain its position and undergoes a breakdown. In such a case, ZIL may shift to a bearish trend, potentially retracing to the demand area or even the strong demand area.

ZIL USDT (Long Trade Setup)Technical Analysis behind ZIL USDT trade:
1. Supported by the immediate support area & Trendline.
2. Supported by the 50 Days SMA.
3. RSI is at 65, a bullish sign.
4. Volume & Momentum analysis also supports the trade.
5. The stop loss is based on the volatility indicator (ATR).

✴️ Zilliqa Moves Above EMA50, Turns BullishWe are looking at the long-term timeframe for the current batch of Altcoins because it's been two-three months since the bottom was hit. After the bottom is hit the doors open for sudden moves to either side.
When we are looking at bottom conditions, only upside is expected. On a down move, risk is strongly limited... Early bird gets the worm.
➖ Zilliqa (ZILUSDT) closed above EMA50 last week.
This week the level was tested and so far holds. There is potential for growth with EMA10 and EMA21 working as backup support in the case of a drop.
➖ Everything is bullish long-term.
Regardless of what happens or can happen short-term, look up, aim up because Cryptocurrency is set to grow all throughout 2024 and beyond.
Namaste.
#Zilliqa $ZIL Trading IdeaFWB:ZIL #Zilliqa is breaking its resistance zone and is now consolidating inside this channel. There is a lot of buying power that can potentially push the price higher. It looks like a real Altcoin Season and if it is so it is a logical thing to look only for LONG/BUY positions. Full send after a breakout of this channel.

ZIL ANALYSIS (1D)The ZIL chart also seems to have completed its diametric wave F and we will soon see a drop for wave G.
The F wave of this diametric can end in the red range. We are looking for a sell/short position in the red range
For risk management, please don't forget stop loss and capital management
Comment if you have any questions
Thank You

Zilliqa (not financial advice)Zilliqa is a layer 1 blockchain which has many advantages:
1) There are no VC in this blockchain, nobody can sell a lot
2) They plan to move to POS and this can stop selling pressure from miners.
3) Rewards for POS are going to decrease slowly.
4) Liquid staking potential (Avely.fi), a total stake can grow 2x potentially and thus decrease circulating supply.
5) Long accumulation zone

ZIL - Ultimate 0.164 yr old strucutre chart on ZIL. Local timeframe not looking great for longs.
Price sitting on weakening suport and floating mid-range in this downward channel.
It might have a chance at $45 which would present a reasonable short opportunity with a decline bottom target of 0.16 however ZILBTC looks like we might see a dip sooner rather than later.
B, HF

ZILUSDT - BULLISH OUTLOOKZILUSDT is presenting a compelling technical opportunity based on recent price action analysis across multiple timeframes. On the 1-hour timeframe, a bullish divergence on the RSI signals a potential reversal or continuation of the bullish momentum. Adding to the positive outlook, the 4-hour timeframe shows a break above a Bearish Trendline, followed by a successful retest of the trendline, indicating a shift in market sentiment.
Here's a summary of the potential trading opportunity:
Entry: Consider entering a long position at $0.0213.
Stop Loss (SL): Set the stop loss at $0.01940 to manage potential downside risk.
Take-Profit Level:
TP 1 @ 1:1 = $0.02316.
This trade plan is designed to capitalize on the observed bullish divergence, the break above the Bearish Trendline on the 4-hour timeframe, and the overall bullish trend on the 1-day timeframe. Managing risk through a stop loss and setting a take-profit level at 1:1 risk-reward ratio aligns with a prudent trading strategy. As with any trading approach, it's essential to stay informed, monitor the trade closely, and adapt to changing market conditions.

Zil#ZIL
It has really very good price to buy or long
SL is tight
Targets you can see on the chart
On HTF 0.05739$ - can be hardest to break, possible that we can see some consolidation at that zone before any bullish or bearish continuation

ZIL Perfect 0.702 Fib Confirmation! Not many know about OTE ;)Zilliqa USDT
OTE stands for Optimal Trade Entry. It's our secret weapon.
OTE is the Fib level between 0.786 and 0.618. It is 0.702 and it has been my best friend in trading for a long time (apart from John lol).

ZIL AFTER the First Successfull Trade. We Open Second OneWelcome to our crypto exploration hub! We're here to navigate the exciting world of digital assets, providing you with comprehensive insights into market dynamics and potential trading opportunities.Our mission is to decode the crypto market's mysteries and equip you with the knowledge you need to make informed investment choices. From the latest developments in Bitcoin to the hidden potential of various altcoins, we're your trusted source for daily technical analysis.While technical analysis is a valuable tool, it's important to remember that it's just one piece of the puzzle. We encourage you to take a well-rounded approach to your investments, considering factors like macroeconomic trends, news, and community sentiment.Join us for the freshest analyses, and don't hesitate to join the conversation in the comments below. Keep in mind that our content is purely for educational purposes and should not be construed as financial advice. Always integrate it into your broader investment strategy."

#zilica #zil will be a pleasure in MID term+ A long time accumulation
+ Long time falling channel
+ Powerful ecosystem
NOT FINANCIAL ADVICE.

🚨 Trade Alert: ZIL/USDT (3-5x)🚨 New Trade Alert 🚨
✅ ZIL/USDT (3-5x)
📉 LONG Entry Zone: 0.02044 - 0.02120
⛔️ SL: 0.01988
🔒 Breakeven Move: When it moves close to TP2
🎯 Take Profit:
Short Term: 0.02141 - 0.0217 - 0.0220 - 0.0225 - 0.0230
Mid Term: 0.0235 - 0.0240 - 0.0250 - 0.0261
📝 Ensure you set entry orders to balance the trade's entry and aim to secure 30% of profits within the first two targets. Once profits are gained, adjust the stop orders to match the entry points or break-even levels.
⚠️ Disclaimer: Historical earnings cannot assure future outcomes. Is there a potential for risk? Certainly. The entire financial market is susceptible to uncertainties; any underlying factor or abrupt shift in market sentiment could overturn the current market trends and lead to losses. Refrain from undertaking undue risks that might jeopardize your financial stability. You are under no obligation to engage in this trade; kindly avoid the trade if you disagree with the trade analysis.
GIS TRADING®


Zilliqa (ZILUSDT)In early November, the price of the #ZIL broke through $0.019, subsequently consolidating around $0.02 - $0.021.
At the current level of $0.021, a potential continuation of the upward trend could lead to $0.025 - $0.0265.
#BTC #Trading #Investing

ZIL| Jewelry test that will make you grow!Hello trader! Today I have a new idea for you. Like and subscribe to the channel, there is a lot of useful information there.✅
Guys, another coin with a classic TA, I expect continued growth after the breakdown of the global countertrend.
Deal plan:
Entry - 0.02270/0.021$
Stop - technical
Take - $0.042
Guys, don’t overestimate the risks, the coin may show high volatility at the moment, be careful!!!

An important point of resistance! If it breaks, a nice rise may Targets: 0,023 - 0,036 - 0,062
This is not advanced work! Please do not consider it as investment advice!


ZIL/USDTwithin 173 days for a breakout for FWB:ZIL but obviously looking at the double bottom pattern it can happen much much sooner, and this coin likes to pump hard historically when it does so set alerts ready for breakout!

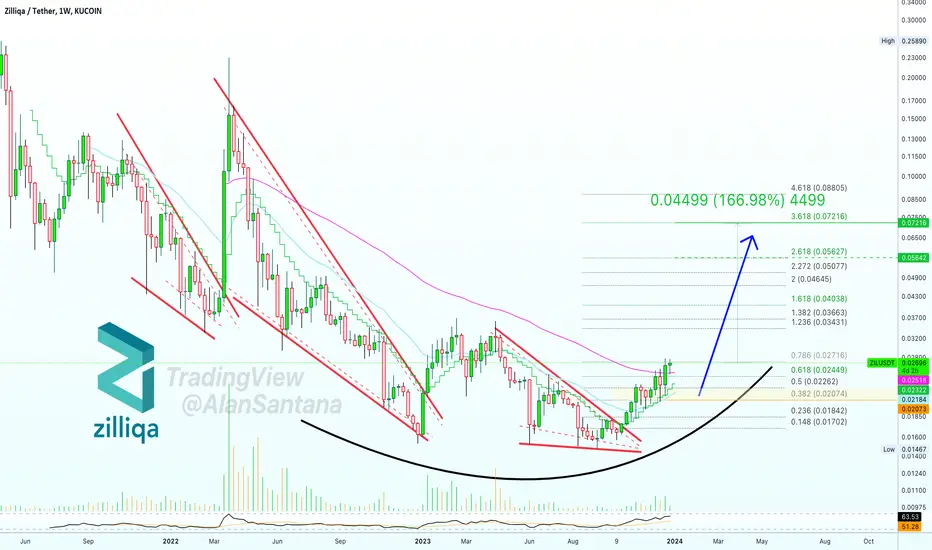
Is Zilliqa preparing a rocket?Hello everyone! Many cryptocurrencies have already shown good growth and while they consolidate in trading ranges, we have Zilliqa. Currently, the asset has broken an important Fibonacci level of 0.236, but its upward momentum was halted by the 200-day Exponential Moving Average (EMA).
A breakout above the EMA 200 will pave the way for the next Fibonacci level of 0.618 from the current values, which is a potential increase of 38%.
Further upward movement towards the price resistance level around $0.033 can be expected, which represents a potential gain of 61%.
In a market with positive sentiment, one could anticipate further upward movement towards the next Fibonacci level of 1.618 or a potential increase of 147% from the current values.
The RSI also appears bullish.
This is not financial advice; all actions are taken at your own risk!

ZilliqaHi, dear traders.Today we have a viewpoint to BUY/SELL the ZIL symbol.
For risk management, please don't forget stop loss and capital management
When we reach the first target, save some profit and then change the stop to entry
Thank You
