ZILUSDTBINGX:ZILUSDT.PS
after Rejection to Order Block you can Entry. but becareful we have an order block above the entry zone. so have good money management.
ZILUSDT trade ideas

ZIL ANALYSIS (4H)Where I entered "Start of correction" is the beginning of our diametric correction pattern.
What the chart shows us seems to be inside wave E of this diametric.
The green area could be where our diametrical F wave starts and moves up to our red area.
Do not open any position without capital management and stop setting.

#ZILUSDT #LQR #TOBTC #LaqiraProtocolThe price is involved in dynamic resistance. If Break and confirmation, you can open trades up to the scalp resistances in the chart, which are obtained from the intersection of static levels and Fibo levels. On specific resistances, after confirmation, you can open scalping trades. This analysis is a buy or sell offer. Is not

ZILUSDTGreat opportunity here, ZILIGA when start runs fast..look the drop on volume on weekly chart. Always that area gives a pump soon later
Take risk without risk on your life and win!

ZIL and the Impressive Investment Opportunity Hi Everyone;
today we have one of the best risk to reward Investment opportunity
it is more than 1600 times the risk and the chart is look very promising.
I expect breaking the previous bear market key point will clear the way to the final target

Zil UpdateSimilar vibe to Vechain.
2 paths presented.
Perhaps mid play was a flat.
Triangle unclear, too much wickery.
Never exclude the sideways 2 that doesnt have to go deep.
However... Everything dips, this does as well.

ZIL is in the sweet shopping zone !!!The price is now in the sweet shopping zone 0.02244-0.01370
Purchase level 0.01753
Now is a good price to enter the position!
Local purchase zone 0.02960-0.01528
Purchase level 0.02241
Global Purchase Zone 0.02247-0.01025
Purchase level 0.01615
Volume price 0.02061

ZILUSD ❕ descending wedgeTrading volumes and volatility are still low.
The price and RSI formed a convergence, and the chart created a descending wedge.
I believe that the asset will rebound soon.

ZIL ANALYSIS (1D)Hi, dear traders. how are you ? Today we have a viewpoint to BUY/LONG the ZIL symbol.
zil provides the conditions to enter the upward movement.
It can move up while maintaining the green area.
I specified two tp. It is not necessary to move up to tp 2, but in case of whale attack, it can go up to tp 2
For risk management, please don't forget stop loss and capital management
When we reach the first target, save some profit and then change the stop to entry
Comment if you have any questions
Thank You

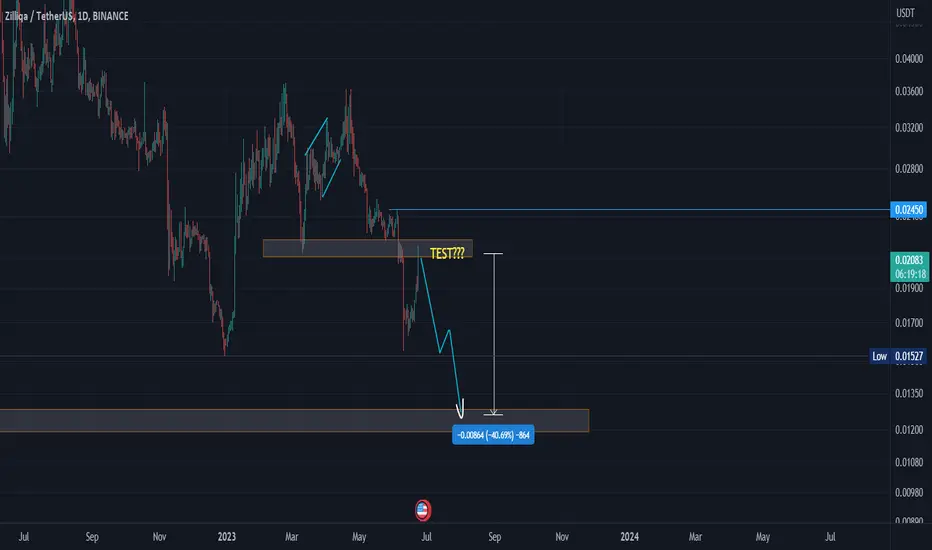
What after the test?From the current general shape, this ascent is nothing but a test of the last broken bottom and closed its predecessors.. Therefore, it will complete a decline again after completing the re-test to the shaded area below.
Note: the analysis fails if the price closes in the highest area 0.0245
ZIL perspectives(C) isnt done IMO.
i expect a retrace if we arent making some sort of a B triang into a giant LD diag.
Everything is possible. But some things are less likely to happen.
For the moment , i put two roads to victory.

Long ZILUSDT (SNR and Fib strategy)Breakout above resistance and waited for price to retest the Resistance Become Support (RBS).
Confluence with the 0.236 Fib pullback.

ZIL : SELL SETUPDisclaimer
High Risk Investment
Trading cryptocurrencies and Forex carries a high level of risk, and may not be suitable for all investors. Before deciding to trade cryptocurrency you should carefully consider your investment objectives, level of experience, and risk appetite. The possibility exists that you could sustain a loss of some or all of your initial investment and therefore you should not invest money that you cannot afford to lose. You should be aware of all the risks associated with cryptocurrency and Forex trading, and seek advice from an independent financial advisor. Since Any opinions, news, research, analyses, prices, or other information contained on this website is provided as general market commentary, and does not constitute investment advice. The Bibres will not accept liability for any loss or damage, including without limitation to, any loss of profit, which may arise directly or indirectly from use of or reliance on such information. All opinions expressed are owned by the respective writer and should never be considered as advice in any form.
A qualified professional should be consulted before making any financial decisions.
-------------------------------------------------------------------------------------------------------------------

ZilusdtLast analysis of zilusdt backs to mar 27 2023
Now we look what happened then to our chart and how was our road map we wrote for today

ZILFriends, this currency is below moving 200, the specified targets are valid. Of course, one of the downward targets has already been hit and supported. Now we expect the price to reach the second target as well.

✴️ Zilliqa Consolidation = Boring & Uncertainty (HH Next)Consolidation periods are characterized by mainly two things, boredom and uncertainty.
Don't you agree?
Zilliqa (ZILUSDT) is now consolidating after recovering from a major low.
The good news here is that the current price trades above its 10-March low/support and also above the 0.786 Fib. retracement level for the 2023 bullish wave.
As long as ZILUSDT trades above these level, the bias is bullish, we expect prices to resume up.
If ZILUSDT breaks below, the bias remains bullish but we would have to wait longer before the next major jump.
Right now we are looking for a higher high compared to February's peak price.
That's all.
Namaste.

$ZILWhen looking at the daily chart of ZIL (Zilliqa), we observe a price movement that is consolidating between moving averages. Over the past few days, it has found support above the 20-day moving average. Additionally, based on the candlestick patterns, there seems to be an impression that this price movement might push itself slightly higher.
Please keep in mind that trading altcoins carries a high level of risk and can lead to substantial gains or losses. Also, it's important to remember that altcoin movements are often influenced by Bitcoin.
With a potential increase of 19%, we can set a target price of $0.0256. This trade is based solely on a short-term prediction and can be affected by any economic data or fundamental developments at any time. Remember that trading altcoins during a bearish market can be challenging and risky. Enter with caution, considering the risks involved.
entry prices= $0.0215 , $0.0205
target price=$0.0237, $0.0255

HOW TO TRADE A DOUBLE TOP PATTERNHi, I have a question about the double top.
Assuming as an example that the neckline of a double top is at a price of 50. This is broken by a candlestick where its spike closes at 48 but its body remains at 51.
Now, the question is: does the pattern break happen when a candle closes below 50 or does it have to go above 48 as well having created a new support there?
We are talking totally about technical analysis, nothing more.
Ty everyone.

$zilHola ,
gut says btc sweep tonite or monday before the giga move up
so looking to long this around then .
Targeting yellow line

$ZIL / ZILUSDTI SEE ZILUSDT IN SHORT POSITION..
GOOD LUCK
• Warning •
Any deal I share does not mean that I am forcing you to enter into it, you enter in with your full risk, because I'll not gain any profits with you in the end.
The risk management of the position must comply with the stop loss.
(I am not sharing financial or investment advice, you should do your own research for your money.)


ZilThe trend in the high time has been an upswing, and in the low time it is hitting its pullback, I will check the long direction in the two green lines.

