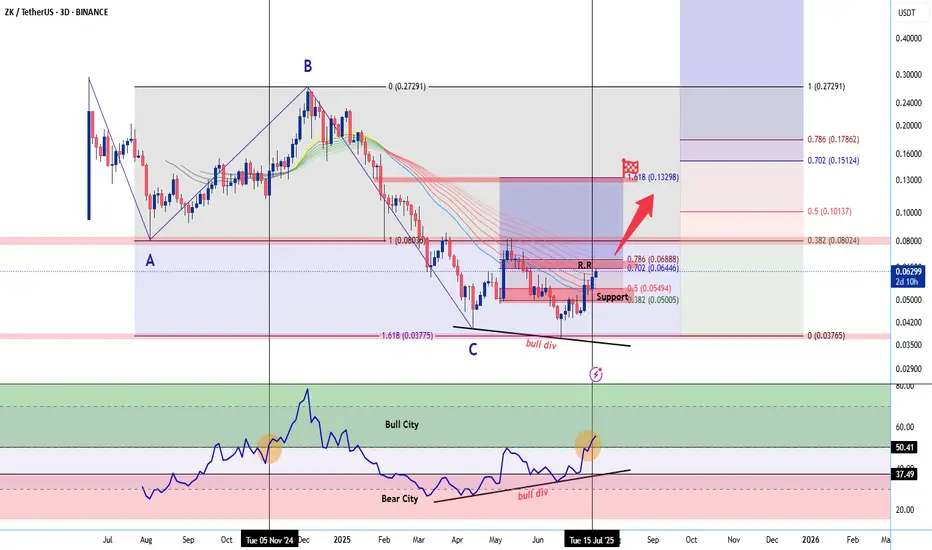
ZKUSDT Elliott Waves analysis📝 Currency NYSE:ZK
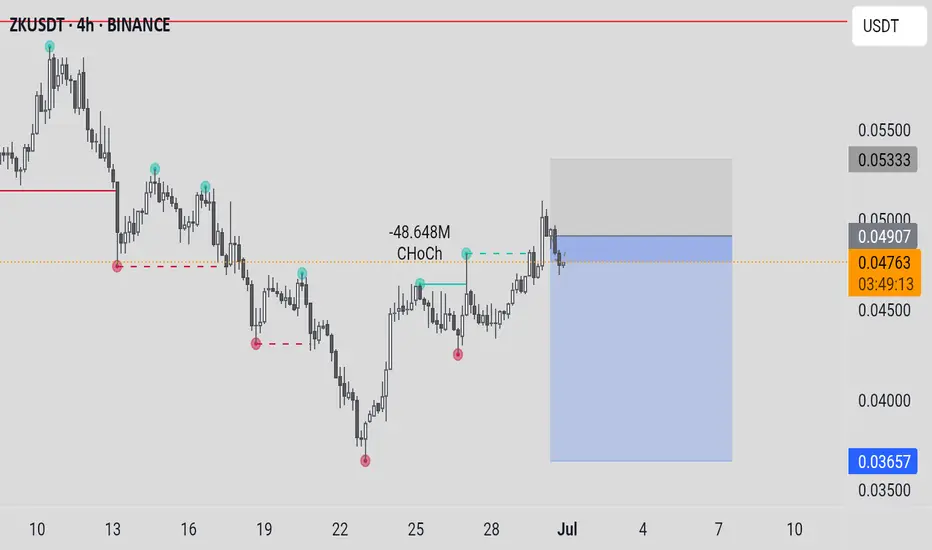
✅ Entry points for the currency: at the current price of 0.06135, the reinforcement should be within the range of 0.05321 - 0.04860
🔴 Stop loss is below 0.03660
💹 Potential targets: first target 0.08140 and if the currency enters a bullish wave, the target will be towards 0.
Related pairs

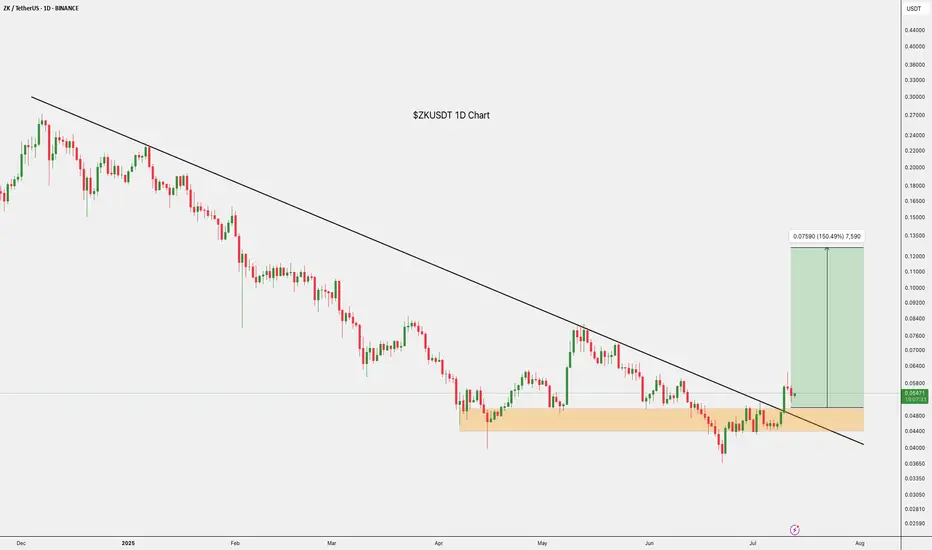
ZK - Golden opportunity? 0.40? Hello everyone, here’s my new analysis on ZK.
Recently, the price surged nearly 80%, followed by an 18% pullback over the last two days. From its all-time high, ZK is currently down about 80%, which in my opinion presents a golden opportunity.
Based on my research, the peaks of altseasons often oc
zkSynch · 988% in the Coming Months · 2025 Bull MarketHere is another pair that is safely trading above EMA55. Notice that after this level was initially conquered 10-July what followed was a retest. Two red candles pushed prices lower and the level held as support. With this, EMA55 is now confirmed and zkSync can easily grow. Mid-term.
When the trad

$ZKUSDT Trade Setup 1D ChartBINANCE:ZKUSDT Trade Setup
Entry: CMP
TP 1: $0.07027
TP 2: $0.8028
TP 3: $0.10841
TP 4: $0.12670
SL:- 0.04774
Breakout confirmed.
Hold above the trendline with a bullish bias.
DYOR, NFA
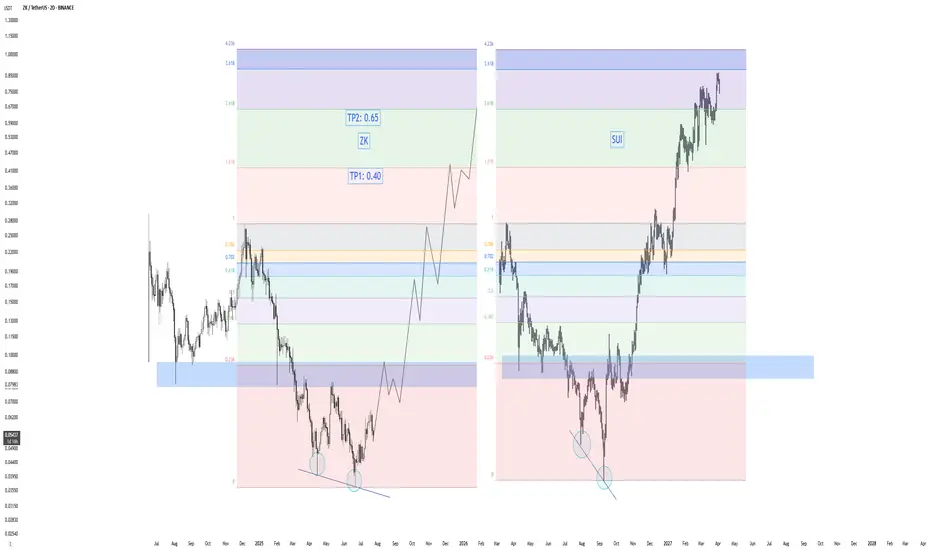
ZK/USDT📢 ZK/USDT Swing Trade Plan – July 18, 2025
🧭 Bias: Macro reversal confirmed (3D/1W)
• OB reclaim ✅
• Bullish divergence on RSI ✅
• Volume uptick + clean invalidation structure ✅
• 1W TD Sequential reset complete
⸻
🎯 Entry Zone (Spot Accumulation):
✅ $0.0585 – $0.0635
→ 3D OB zone + 0.5 Fib + previ
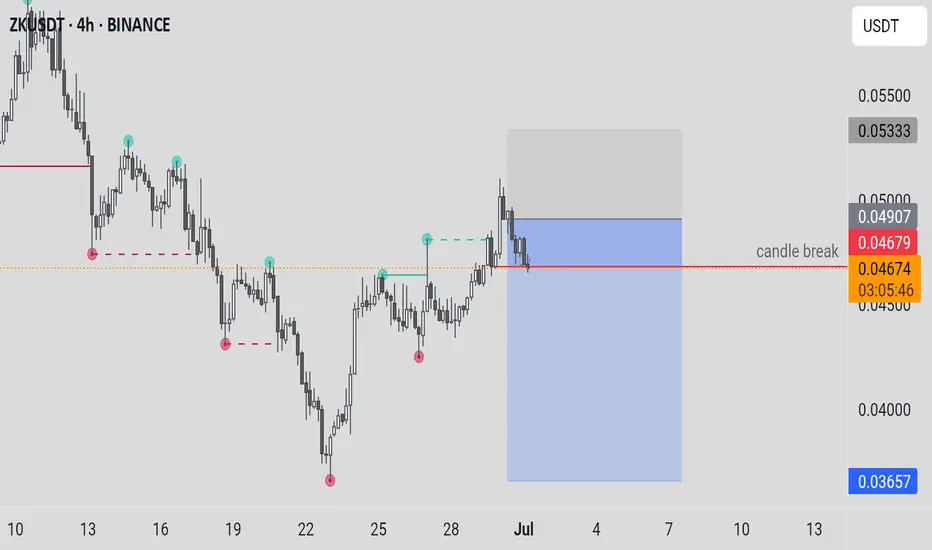
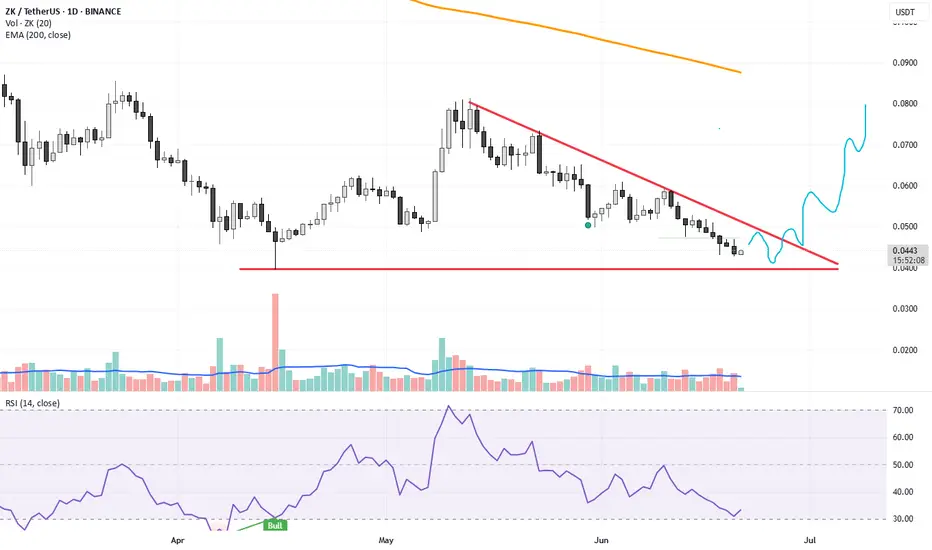
ZK — Trendline Break & FVG RetestHTF sweep + FVG retest + trendline break — clean R/R setup. Enter after confirmation, main target $0.0806, stop below $0.043.
1. Buy zone: $0.043–0.049 (FVG + trendline retest)
2. Enter after clean reclaim above trendline
3. Main target: $0.0806
4. Stop: below $0.043
If fails to reclaim — stay fla

ZKUSDTCryptocurrency Futures Market Disclaimer 🚨🚨🚨
Trading cryptocurrency futures involves high risks and is not suitable for all investors.
Cryptocurrency prices are highly volatile, which can lead to significant gains or losses in a short period.
Before engaging in crypto futures trading, consider you
VETUSDTCryptocurrency Futures Market Disclaimer 🚨🚨🚨
Trading cryptocurrency futures involves high risks and is not suitable for all investors.
Cryptocurrency prices are highly volatile, which can lead to significant gains or losses in a short period.
Before engaging in crypto futures trading, consider you
ZK USDTif zk broke the resistance upper red line
it will boost the price to get the big profit.
Don't buy now just keep eye on it.
wait for broke and retest the level again then enter into trade.
ZKUSDT 2D AnalysisZK ~ 2D Analysis
#ZK This trade is very risky, buy if you still have confidence in this coin with a short term target of at least 15%+ from here.

See all ideas
Summarizing what the indicators are suggesting.
Oscillators
Neutral
SellBuy
Strong sellStrong buy
Strong sellSellNeutralBuyStrong buy
Oscillators
Neutral
SellBuy
Strong sellStrong buy
Strong sellSellNeutralBuyStrong buy
Summary
Neutral
SellBuy
Strong sellStrong buy
Strong sellSellNeutralBuyStrong buy
Summary
Neutral
SellBuy
Strong sellStrong buy
Strong sellSellNeutralBuyStrong buy
Summary
Neutral
SellBuy
Strong sellStrong buy
Strong sellSellNeutralBuyStrong buy
Moving Averages
Neutral
SellBuy
Strong sellStrong buy
Strong sellSellNeutralBuyStrong buy
Moving Averages
Neutral
SellBuy
Strong sellStrong buy
Strong sellSellNeutralBuyStrong buy
Displays a symbol's price movements over previous years to identify recurring trends.
Frequently Asked Questions
The current price of ZK / TetherUS (ZK) is 0.05694 USDT — it has risen 1.48% in the past 24 hours. Try placing this info into the context by checking out what coins are also gaining and losing at the moment and seeing ZK price chart.
ZK / TetherUS price has fallen by −3.19% over the last week, its month performance shows a 29.82% increase, and as for the last year, ZK / TetherUS has decreased by −63.52%. See more dynamics on ZK price chart.
Keep track of coins' changes with our Crypto Coins Heatmap.
Keep track of coins' changes with our Crypto Coins Heatmap.
ZK / TetherUS (ZK) reached its highest price on Jun 17, 2024 — it amounted to 0.29500 USDT. Find more insights on the ZK price chart.
See the list of crypto gainers and choose what best fits your strategy.
See the list of crypto gainers and choose what best fits your strategy.
ZK / TetherUS (ZK) reached the lowest price of 0.03660 USDT on Jun 22, 2025. View more ZK / TetherUS dynamics on the price chart.
See the list of crypto losers to find unexpected opportunities.
See the list of crypto losers to find unexpected opportunities.
The safest choice when buying ZK is to go to a well-known crypto exchange. Some of the popular names are Binance, Coinbase, Kraken. But you'll have to find a reliable broker and create an account first. You can trade ZK right from TradingView charts — just choose a broker and connect to your account.
Crypto markets are famous for their volatility, so one should study all the available stats before adding crypto assets to their portfolio. Very often it's technical analysis that comes in handy. We prepared technical ratings for ZK / TetherUS (ZK): today its technical analysis shows the neutral signal, and according to the 1 week rating ZK shows the sell signal. And you'd better dig deeper and study 1 month rating too — it's sell. Find inspiration in ZK / TetherUS trading ideas and keep track of what's moving crypto markets with our crypto news feed.
ZK / TetherUS (ZK) is just as reliable as any other crypto asset — this corner of the world market is highly volatile. Today, for instance, ZK / TetherUS is estimated as 4.16% volatile. The only thing it means is that you must prepare and examine all available information before making a decision. And if you're not sure about ZK / TetherUS, you can find more inspiration in our curated watchlists.
You can discuss ZK / TetherUS (ZK) with other users in our public chats, Minds or in the comments to Ideas.