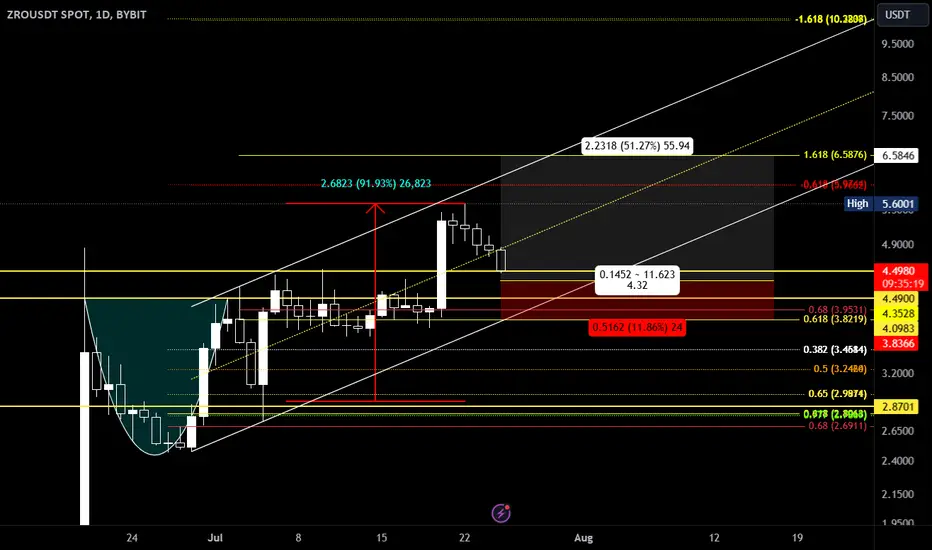
ZRO — One To Watch!ZRO presents a fascinating chart setup, showcasing significant strength compared to the broader market. Unlike many other tokens that have struggled, ZRO has mainly held its ground. Moreover, it’s approaching a crucial moment.
Two key levels will be essential to watch:
‣ ZRO needs to break out of the current downtrend.
‣ Subsequently, it has to pump above the $4 mark.
We could see a solid move toward $4.5 if these two conditions are met. Moreover, if ZRO establishes a higher high, $5.5 is the next target.
On the downside, ZRO has strong support, around $3, which has held well. The level around $3.5 should also act as a solid firewall, providing the first line of defense.
Adding to the positive momentum, the VMA (Volume Moving Average) has recently turned bullish. This could indicate the beginning of an upward surge.
ZRO could be one of the strongest players depending on this week's market.
ZROUSDT trade ideas

ZRO ANALYSIS (4H)It looks like a triangle is forming.
Now it looks like we are in wave e.
The red range is a suitable place for sell/short positions.
Closing a daily candle above the invalidation level will violate the analysis.
For risk management, please don't forget stop loss and capital management
Comment if you have any questions
Thank You

#ZRO/USDT#ZRO
The price is moving in a descending channel on the 4-hour frame and is sticking to it very well and is expected to break it upwards
We have a bounce from a major support area at the lower line of the channel at 3.20
We have a downtrend on the RSI indicator which supports the rise
We have a trend to stabilize above the moving average 100
Entry price 3.30
First target 3.50
Second target 3.77
Third target 4.03

ZRO Analysis on Low TF / Long Trigger on Specified AreaBINANCE:ZROUSDT
In this post we have a three-drive pattern on ZROUSDT.
This pattern is very suitable for short positioning. Our short trade entry point is activated when the price breaks the lower line of the pattern and does not return above it.
Also, after the formation and completion of the three-drive pattern, when the price reaches the nearest important support area, it can trigger a price reversal.
In a price reversal strategy, multi-step entry inside the support zone will give the best results.
Hope this post helps you all.
Please let me know what is your idea?

ZRO sell/short setupZRO appears to be completing a more complex triangle or pattern.
A good supply is formed on the chart.
When the price reaches this supply, we expect a price rejection.
Closing a daily candle will invalidate the analysis level.
For risk management, please don't forget stop loss and capital management
Comment if you have any questions
Thank You

ZROUSDTZRO ~ 1D ✅
#ZRO This is a bullish pattern for now. It will still be necessary to confirm the break of the resistance line of this pattern to confirm.
If you have Conviction on this Coin,. Purchases in this pattern may need to be considered or perhaps you should leave 50% of your USDT for purchases in the demand zone, to maintain Worst possible.

Alikze »» ZRO | Pullback to broken structure🔍 Technical analysis: Pullback to broken structure
- It has been moving in an ascending channel in the 4H time frame.
- Currently out of the ascending channel. Considering that a corrective form has been formed, any reversal can be faced with selling pressure up to the neckline and supply range.
- Therefore, after the demand in the middle of the short-term descending channel, it can continue the downward trend to the bottom of the descending channel after the pullback to the broken structure.
- The first support area and the 100 Fibo retracement area is 3.47 and after its failure, it can continue until the correction demand area.
💎 Alternative scenario: In addition, if this return so that the neck line can break the supply area and stabilize above it, it can continue its growth up to the previous ceiling and the next supply range.
»»»«««»»»«««»»»«««
Please support this idea with a LIKE and COMMENT if you find it useful and Click "Follow" on our profile if you'd like these trade ideas delivered straight to your email in the future.
Thanks for your continued support.
Best Regards,❤️
Alikze.
»»»«««»»»«««»»»«««
BINANCE:ZROUSDT

ZRO PUMP?We see a geometric triangle on the chart that has reached maximum compression. The coin is very strong and has the potential to go much higher, but the targets I see right now are indicated on the chart.

LayerZero ZRO price shows strengthCurrently, #ZROUSDT is in a broad consolidation after the first wave of growth.
A positive sign is that in recent days, #ZRO price has been held above the mirror level of $3.70
✔️ Safe buy around $3.37 for medium- and long-term positions
😉 You can think about selling part of the #ZROUSD position around $5
_____________________
Did you like our analysis? Leave a comment, like, and follow to get more

LayerZero May hit $3.8 to $3.6 zones.LayerZero May hit $3.8 to $3.6 zones.
I called to short LayerZero 22 hours ago, we have hit out $4 TP.
The selling momentum is still strong, hopefully, it will get to $3.8 or $3.6

ZROUSDT Is a Major Move on the Horizon? Don't Miss it!Yello, Paradisers! Are you ready for what could be a game-changing moment for #ZROUSDT? Let's dive in.
💎Currently, #ZRO is testing the support level, which was previously a resistance before the breakout from the cup and handle bullish reversal pattern. This pattern indicates strong bullish momentum. If ZRO can hold this support, we could see the price continue its upward movement toward the next key resistance level at $4.64. A breakout above this zone would pave the way for ZRO to potentially reach our target at the all-time high area.
💎However, be cautious—if ZRO fails to rebound from the $3.76 support area and breaks below it, the price may revisit the major support zone between $2.89 - $2.70. Historically, this zone has shown strong support, and it's possible that the price could rebound from here, resuming its upward trend.
💎The bullish scenario would be invalidated if ZRO's daily candle closes below the critical support level at $2.465. This area marks the previous low, and breaking below it could lead to a new lower low, signaling a deeper correction ahead.
Stay focused, patient, and disciplined Paradisers.
MyCryptoParadise
iFeel the success🌴

ZROUSDTWe can attempt to buy ZROUSDT from specified level if it break LH , also bullish divergence occur indicate that it moves upward.
SL , TP mention in chart.

Could ZROUSDT Be on the Verge of a Major Breakout? Yello, Paradisers! Are you ready for a potential bullish move on ZROUSDT? We've got our eyes on this one, and it's time you do too!
💎#ZROUSDT has been closely following a descending trendline, and it's now approaching a critical point. If the price manages to break above this trendline and successfully retests, we could see a significant bullish run up to the next probable resistance level.
💎But what if the breakout fails? Don't worry; we've got that covered too. In case ZROUSDT loses momentum and doesn’t break upward, we’re eyeing a bullish rebound from the lower demand zone at $3.199.
💎This level could act as a strong support, offering a potential pivot point for a bullish reversal. However, be cautious a drop below this key level could lead to a notable bearish phase.
Remember, always employ prudent trading strategies and ensure you have proper stop-loss measures in place. Stay alert to market movements, and we’ll keep you updated with more insights.
MyCryptoParadise
iFeel the success🌴

Is #ZROUSDT Poised for a Breakout or a Breakdown? Let's SeeYello, Paradisers! Is #ZROUSDT about to explode, or are we looking at a potential dip? Let's look at the latest analysis of #LayerZero:
💎#ZRO is currently nestled within a key demand zone around $2.94, showing signs of a potential breakout. As it hugs the descending resistance, we're approaching a critical juncture that could trigger significant bullish momentum.
💎If CSE:ZRO breaks above this channel resistance, we might see a powerful surge upward. However, caution is warranted—if momentum stalls and the price fails to hold this support, a bullish rebound could occur from the lower support around $2.75. This level is likely to offer a push due to the high liquidity in this area.
💎But keep your eyes on the next level, if this support also fails, the price could find a bullish breakout from the lower demand zone at $2.46 and move to breakout of this setup.
💎On the flip side, if the price breaks below this level, the bullish setup could be invalidated, leading to a significant drop.
Stay focused, patient, and disciplined Paradisers!
MyCryptoParadise
iFeel the success🌴

#ZRO/USDT breaks the Diagonal Trendline in 4-Hour TF!#ZRO/USDT breaks the Diagonal Trendline in 4-Hour TF!
CSE:ZRO needs to clear the PDH $3.767 resistance level to turn bullish. The next local resistance level is PMH $5.609 and the support level is PDL $3.234.

ZRO analysis (4H)ZRO has just been listed on exchanges and not much data is available on this token.
We have a long shadow resistance range, 70-100% of this long shadow is considered an important resistance.
We expect the price to be rejected when it hits the red box.
The targets are clear on the chart.
Closing a daily candle above the invalidation level will violate the analysis.
For risk management, please don't forget stop loss and capital management
Comment if you have any questions
Thank You


ZRO: BearishThe market sentiment for ZRO is currently bearish, with technical indicators suggesting caution due to potential downside risks.
Key Factors Influencing ZRO Price
MACD: The MACD is bearish, with the histogram at -0.014, MACD line at -0.220, and the signal line at -0.206. This indicates strong bearish momentum.
Stochastic Oscillator: With %K at 3.90 and %D at 5.25, the Stochastic Oscillator shows oversold conditions, suggesting a potential short-term rebound.
RSI: The RSI at 26.39 indicates that ZRO is in oversold territory, which could signal a potential reversal or consolidation.
Potential Market Scenarios
Bullish Scenario:
A break above the local resistance at $3.75 could lead to further upward movement, potentially targeting the solid resistance at $4.17. This move would likely confirm bullish momentum and attract more buyers.
Bearish Scenario:
If ZRO fails to break above the local resistance, it could retest the support levels at $3.33 and potentially fall to the solid support level at $3.00. A break below $3.00 could signal further declines, with dynamic support suggesting lower targets.
Conclusion and Market Outlook
ZRO is currently positioned with significant support and resistance levels to watch. The bearish MACD and overall market activity suggest caution, as the potential for further declines exists. Monitoring the key resistance levels and potential support levels is crucial for making informed trading decisions.

#ZRO/USDT#ZRO
The price is moving in a descending channel on the 1-hour frame and we are about to break it
We have a bounce from a major support area in green at 3.80
We have a downtrend on the RSI indicator that has been broken upwards
We have a trend to stabilize above the 100 moving average, which supports the rise
Entry price 3.96
First target 4.16
Second target 4.39
Third target 4.64

ZRO shortZRO broke through the support level and the ascending trendline. Decline to support level at $3 is expected to happen

#ZRO fresh setup Fresh entry on our already running position which is already 70% profit booked
watching the ascending channel if hold the support
#ZRO/UDT#ZRO
Our price is moving downward on a 1-hour frame and is rising from the current levels
We have a bounce from the lower border of the channel from the support area at 4.35
We have a tendency to stabilize above the Moving Average 100
We have a downtrend on the RSI indicator that is heading up and supporting it
Entry price is 4.40
The first goal is 4.78
Second goal 5.17
Third goal 5.56

ZRO, 5.417, LONGThe token does not react to market pullbacks and looks much stronger than the market. False breakouts are redeemed. Large accumulation below the key level, which can give a good impulse when entering the long zone.
