ZRXBTC trade ideas
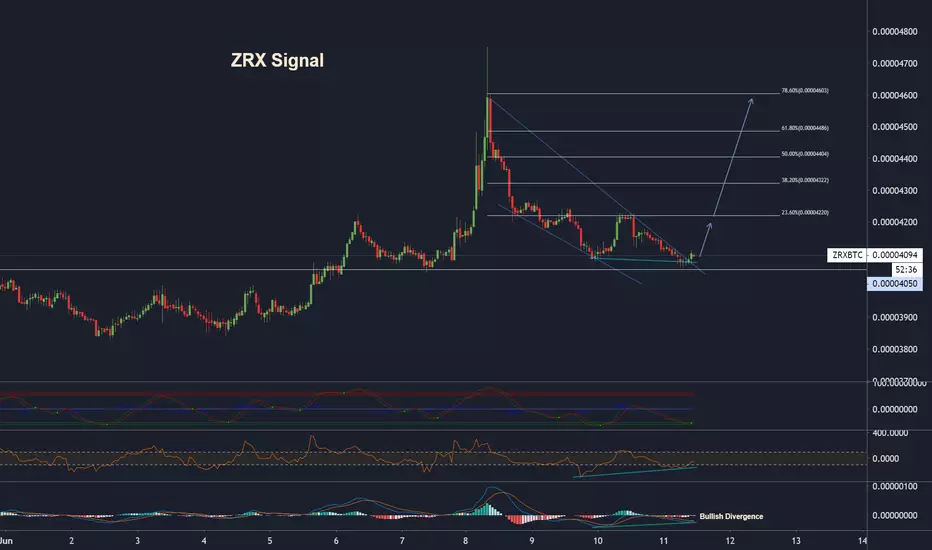
ZRX Signal by Rocket-ProZRX broke its wedge configuration, bullish divergence on CCI and MACD and WaveTrends cross.
Buy : Current price
T1 : 4220 (23.6% Fib)
T2 : 4400 (50% Fib)
T3 : 4600 (78.6% Fib)
You may sell 33% of your position at each target !
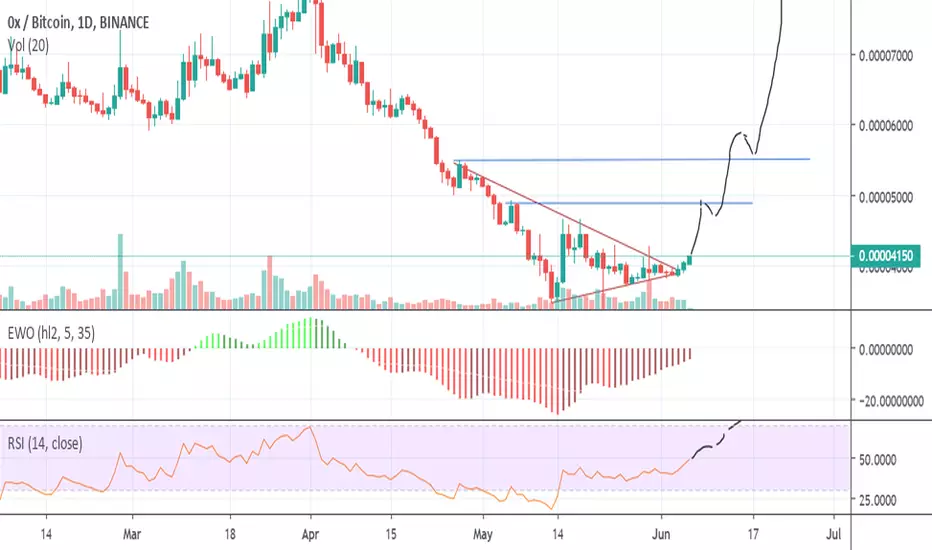
ZRX/BTC! Ascending Triangle!
ZRX/BTC!
Day Chart Pattern: Ascending Triangle
Daily Trend: Upsloping Bullish Trend
Possible trend: Bullish
Divergence: Bearish Divergence playing out.
Candlestick Pattern: None
Volume: Low
Time Frame: Day Chart
My Targets: Probability can change.
Reward to Risk: 2/2
Possible Entry: What I'm looking for:
.00004038 - .00004158
Resistance needed broken with candle close above .00004158 to continue to next target!
Targets Can exceed or not meet expectation
1 .00004329
2 .00004475
3 .00004635
4 .00005205
5 .00005996
Stop Loss: Base on a Daily Candle Close.
1 .00004000
2 .00003870 next target if first stop
loss support broken with a candle
close
Please remember to DYOR and this is not financial or investment advice. It's my targets for the market at this moment. Please let me know what you think of my technical analysis and thank you.

ZRX, Long Trade Setup With Over 500% PPFalling wedge is forming after the last run on May a year ago, and currently we are in the bottom of wedge.
need to break the the upper line of falling wedge resistance so there is pottentially bull run on ZRX will be started.
on the 1D time frame we can see Adam & Eve pattern and also pottentially Cup and Handle pattern formed and we need to break the price around 4470.
Remember that this in idea only, do with your own risk


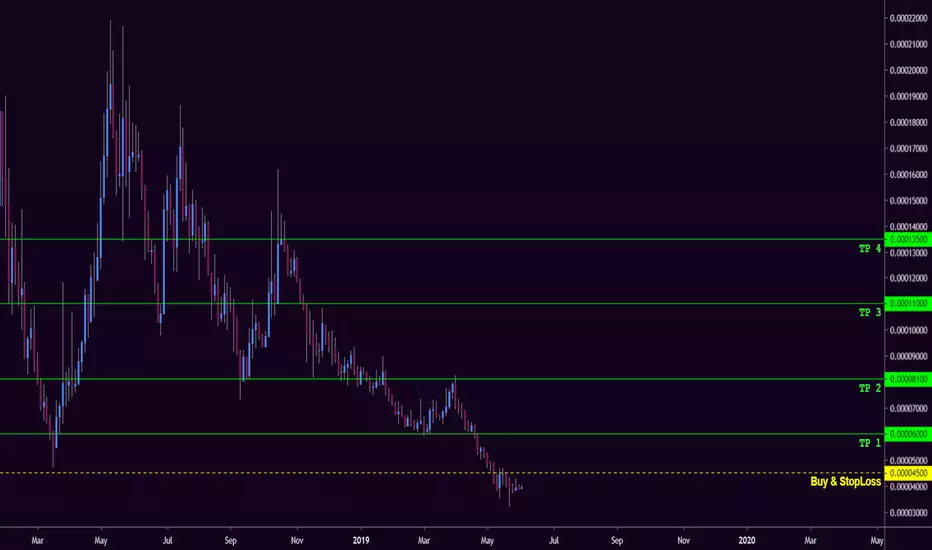
ZRX OR 0X .. LETS ACCUMULATE IT ACCUMULATION OF THIS COIN COULD CHANGE YOUR LIFE LATER
STOP LOSS 10% AS PER CHART
TARGETS AS PER CHART UP TO 100% PROFITS IN 2019
SIGNAL UP TO 3 MONTHS
BEST OF LUCK


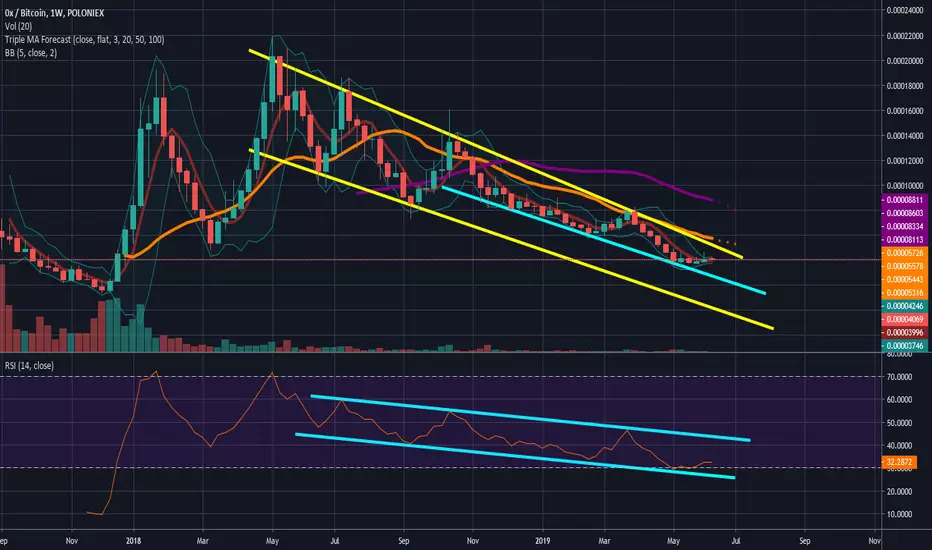
ZRX starting to look ready to move.Showing in the 1Month charts
June 8th 2019 - Present the building of an
Adam and Eve pattern and we are at the bottom or near
before the back half of the pattern.
Full TD8 count on monthly.
Showing on the 1W charts
May 7th 2018 - present the building of a large
descending triangle. We are nearing the apex of it.
Time for it to break out or break down.
Things which support a break up.
*Adam & Eve pattern on 1M
*1 Year descending wedge triangle
*decent volume Inverted hammer
*full TD9 on the monthly
*two full TD9s finished on the weekly
*weekly td1 is so far a green hammer.
*macd, rsi, stoch all look to be turning bullish.

$ZRX with an Adam & Eve Pattern?1D is showing an adam & eve Pattern and a solid reversal in the making. This is an old 2017 alt that may not pump to the same heights as it did before now and in the future. Still lots of potential, though, given how far it has retraced.
@cryptologging

ZRX Symmetrical pattern trade setupZRX forming a symmetrical triangle.
Stoch RSI and MACD are raising
SBS Indicator signaled BUY
BUY at the breakout
Target and SL are on the chart

ZRX just starting.- RSI sitting comfortably around 50
- Close above 4400 on Daily would just pump it like anything
- Stop loss around 3700 sats
- Target - 4800, 5400, 6300, 8000
$ZRX Worth paying attention to new hours/days..$ZRX Worth paying attention to new hours/days.. It looks kinda ready to make some movements..
Potential symmetrical triangle about to breakout
Both RSI & MACD rising
UCTS Buy signal active on the 12h chart, still missing in the 1D
Volume looks low for now.
#ZRX


Zrx (0x) break out!!! Volume is increasing and broke out from the down trendline. We need to wait for 16:00 (UTC) to confirm the break out but I feel like this time we will break that resistance.
Targets
4493
4831
5351


ZRXBTCTriangle formed
More inclined to break up
Risk profit 1 to 3
Enter: 3850 - 3880
Stop: 3675
Target: 4500
