ZRX double bottom?ZRX doesn't look the greatest right now but it could very well be forming a double bottom here near the lows
Sitting right at support, a strong move away from this demand zone could spell some very nice upside in the coming weeks
A break to new lows could spell problems and the trade would be cut
Thanks guys!
ZRXBTC trade ideas


Inverted H&S possibleDear Colleagues, recent new lows confirmed momentum to the downside. Expecting reverse on the red line and possible iH&S being drawn further in time.
Please leave a like if you like the material, thank you :)

0x Potencial 10% Gain Hi Folks,
we are about to get some profit from 0x.
I think we will see some push upward - not sure if it will hit 10% but hope we see some green :-)

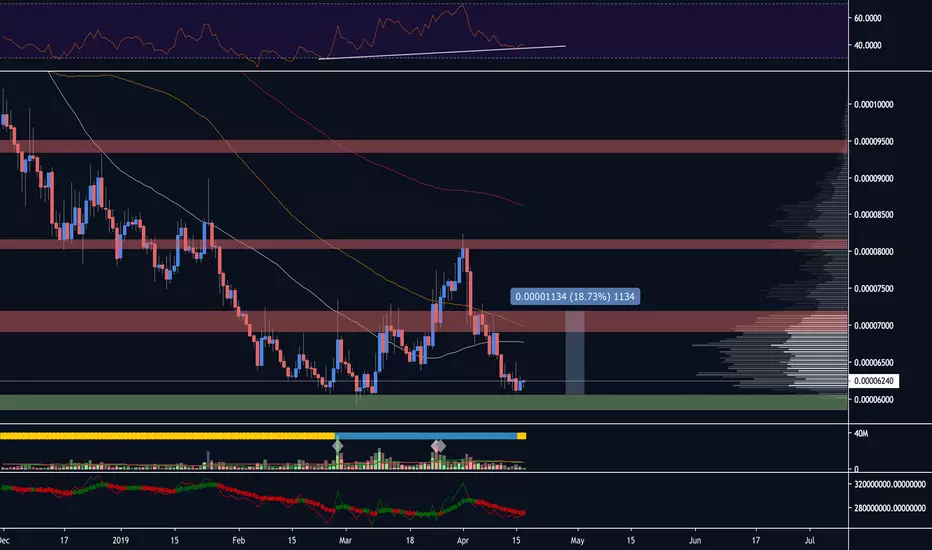
ZRXBTCZRXBTC
Entonnoir : W/D/H4 (swing)
Nous avons également un setup intéressant sur cette paire avec une compression daily (jaune) sur le point de se former en bas de la compression weekly (blanc). Si on en sort par le haut, le biais weekly deviendra haussier et il serait intéressant de se placer à l'achat à ce moment là.
—————
Funnel : W/D/H4 (swing)
Also another interesting configuration on this coin with a daily compression (yellow) starting to shape at the bottom of the weekly compression (white). If we break that future daily compression by its top, the bias would become bullish and it would be interesting to go long on this setup.

ZRX looks ready for round #2Price seems to have found a base here and RSI is showing a higher low (bull DIV)
We could see a move back up to supply IF BTC doesn't do anything crazy in the next few days/week
Thanks guys!

ZRX - Multiple time frames show near bottomShowing in the 1Month charts
Jan 15th 2018 - Present the building of an
Adam and Eve pattern and we are at the bottom or near
before the back half of the pattern.
Showing on the 1W charts
May 7th 2018 - present the building of a large
descending triangle. We are nearing the apex of it.
Time for it to break out or break down.
Things which support a break up.
*Adam & Eve pattern on 1M
*1 Year descending wedge triangle
*decent volume Inverted hammer

ZRX - 1M Adam and EveShowing in the 1Month charts
Jan 15th 2018 - Present the building of an
Adam and Eve pattern and we are at the bottom or near
before the back half of the pattern.
Showing on the 1W charts
May 7th 2018 - present the building of a large
descending triangle. We are nearing the apex of it.
Time for it to break out or break down.
Things which support a break up.
*Adam & Eve pattern on 1M
*1 Year descending wedge triangle
*decent volume Inverted hammer


10:1 RR on ZRXBTCAlthough wave 1 wasn't impulsive, we have had an 85.4% retracement which makes for a good RR ratio.
Break of the March low will invalidate.
The weekly MACD has crossed above the signal line for the first time since June 2018.
The 161.8% Fib lines up quite nicely with the upper boundary of the inside pitchfork, as well as the low of the June capitulation.
Resistance at the top of the weekly BB however which is below the target. Could take some profits there and look for a better entry.
See how it plays out.

0x [ZRXBTC] Prepares for a Bullish Wave (150% Profit Potential)Welcome to this updated analysis on ZRXBTC Let's get right to it!
Would be equivalent to a rise of 150% Therefore, if 0.00006998 can hold support line
if this bullish roll in, maybe ZRXBTC will break resistance and reach 0.00006998, bullish flag projection.
A breakout above the trend line would cause ZRXBTC to rally to about 150%
I expect to see a breakout to the upside.
ZRXBTC Targets:
0.00006239
0.00006998
0.00008031
This information is to be used for educational purposes only
TRANSPARENCY Strategy
For more content, be sure to hit that follow button
www.iiwowii.com
web.telegram.org

$ZRX Another asset sitting at a good support level (~6300sats)..$ZRX Another asset sitting at a good support level (~6300sats)..
Bounce from here could be expected as market starts to rise
I would like to see better volume levels or a daily close above the support level as signals of confirmation..
Will update as soon as I see changes!
#ZRX


ZRX BTC looks interesting. Also Roadmap Update TweetedZRX at support but still unstable with BTC movement. New Roadmap update tweeted by 0x
Tweet by 0xProject
#ZRX
0x Roadmap 2019 (part 4) — Proposal for Stake-based Liquidity Incentives

ZRX longGood time to buy zrx, currently fell down on the support around 7k sat after bitcoin push. Bullish RSI divergence on 30m


0x (ZRX) This is one of the more dormant alts that hasn't moved much compared to other mid-cap alts since Bitcoin price skyrocketed past $5.3k a few days ago. Expecting a good move pretty soon. Bullish Divergence and breakout of downtrend in the RSI.

ZRX under huge accumulation? #crypto $zrx $0x #tatipObserving ZRX in the 3D chart there are some clear signs of accumulation.
- Head & Shoulders pattern forming right into support which is a clear indication of accumulation in this zone
- Strong resistance turned into support
- Volume during the sideways phase is greater than the trending phase (!!)
Overall all these signs are an alarm for ZRX, it's also one of the most underperforming coins for 2019 so it may be the next winner.

ZRXBTCbuy if break 0.00007067
sell at :
level 1 : 0.00008230
level 2 : 0.00009393
Stop :
close of two candles under :
0.00006700
