0x BOUNCE COMING?$ZRX 0x is inching towards a previous bounce area, Looks like it'll pull off some huge gains.
ZRXBTC trade ideas
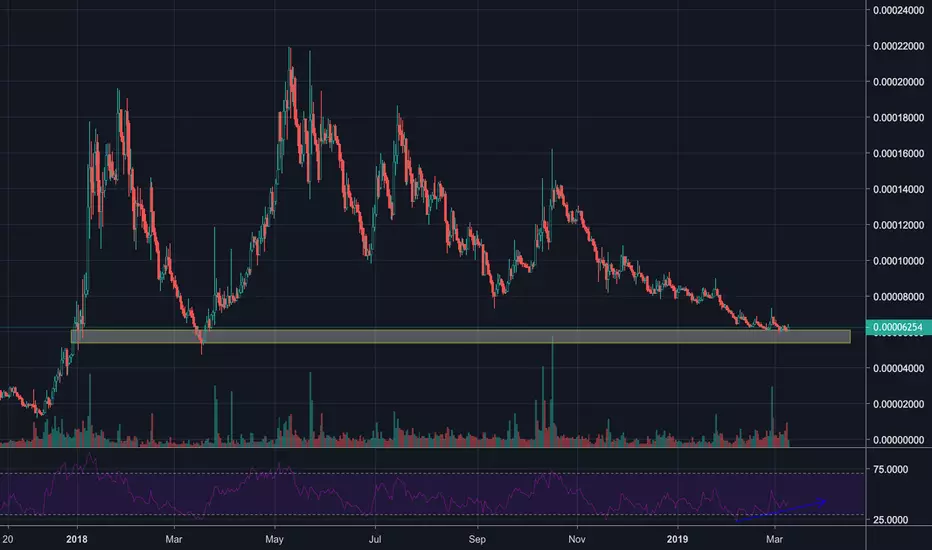


ZRX could be the next taking offI have to be honest 0x looks juicy but daunting to trade at the same time.. Falling wedge in confluence with horizontal support. If this bounces, it'll be hard. I'd be targeting 0.618 fib it it bounces as TP1. BB Bands can't get tighter more.

ZRX - Great Long-Term Entry PointLooking at ZRX's daily chart, the last breakout completely retraced back into the triangle and bounced off an historical support area. With the price still within the confinements of a falling wedge and with bullish divergence on both the MACD and RSI indicators, I'll be looking for a big breakout once the price clears the 25MA. The daily MACD is also approaching the zero line which could do wonders for the price once broken. I'll be making a long purchase here.

ZRX short time frame channelOverall price action downward along pitchfork. T/P at control price and up to green in channel on short time frame. Longer time frame, trending downward but near bottom.


ZRXBTC LongForgot to share this entry. Entry picked up today for swing trade on ZRX or if structure holds will stay in.

ZRX Breakout?It puts the green on the chart or else it gets the Bart
But rly this is looking good....

ZRX ready to pop! - #ZRX $ZRXZrx looking ready to pop!
RSI is showing bullish divergence on the daily.
Volume is increasing.
MACD histogram is beginning to uptick on the 4H.
These are early signs and it’s looking like it is getting ready to make a move.
Enter between 5900 – 6100
Take Profit Targets:
TP1 9681
TP2 12016
TP3 13903
TP4 15791
TP5 18477
I’d suggest a wider stop on this trade as it looks to be still forming a base. Alternatively sit out for a while and wait and see how the price reacts in this range, and enter once there is confirmation.
Happy trading.


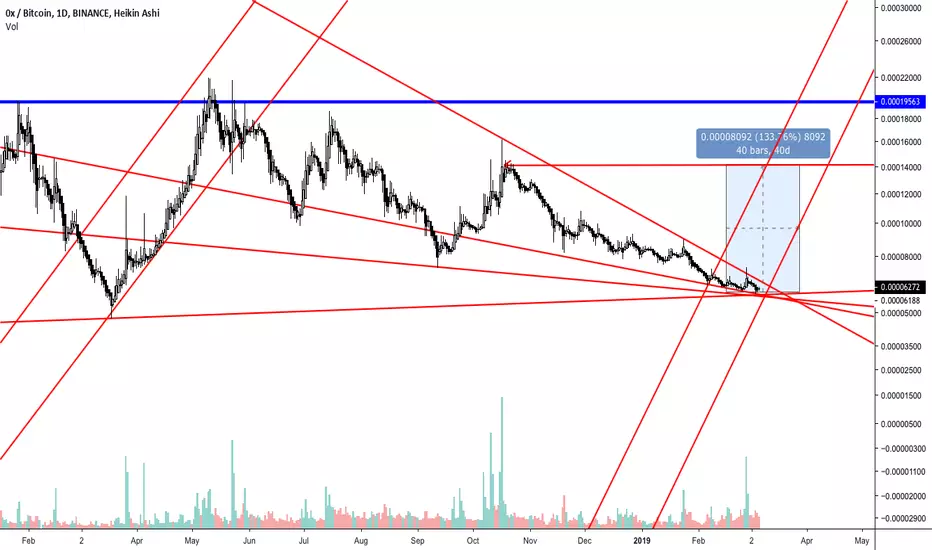
0x (ZRXBTC) time and price squared - massive move expectedOne WD Gann’s ways of predicting future price action and forecasting of future profit targets was identifying areas where price and time are squared. I’ve learned that Gann’s used of the word ‘squared’ doesn’t always mean a confluence zone of one of his Square’s to one of his time cycles – but in the case of 0x, that is the case. 0x is sitting, right on a square of price and time. Notice the intersection of the red vertical and horizontal lines on the chart. Both of those lines represent an important behavior: pivots. The natural time pivot (red vertical line) is important because it acts as a source of resistance in time to the trend in force. Time cycles themselves are often powerful enough to predict future price action, but 0x has another thing that helps with that prediction. The 0.00006343 value area is 2/8th Major Harmonic level. Major Harmonic levels are the most difficult price levels for traders to trade above or below. And each harmonic level has a different ‘behavior’ in the case of this current 2/8th Major Harmonic – it represents a natural pivot, the most powerful pivot on a chart. When price action is trading right inside this confluence zone – especially after such a prolonged downtrend, we can predict and expect powerful bullish moves in the very near future. As far as finding a price zone to predict, that becomes a little easier. Given the strength of this confluence zone, the next and most logical profit zone is the 4/8th Major Harmonic level at 0.0001530. We can even predict the date range. The next square of price and time happens on April 2nd, 2019 at the 0.0001530 price level. Price action tends to trend in one direction between these two time harmonics.


zrx BullishThere is agood support at 62!! and it can be a very good opportuinty to take profit out of it!!!
Buy zone:61-64
sl:6050
Target:68-72
