ZRX Descending Triangle ZRX has a clear descending triangle . The one hour chart shows several key bearish candlestick patters, most recently a hanging man candle stick. There is resistance around 0.36, however looking on the day chart, the RSI is completely maxed out around 80 at the time of writing this. It is certainly possible we retest the 0.50 cent area, on the 1 week chart there is major resistance around 0.55 cents.
Please do not trade based on this information. What do you guys think about ZRX?
Thanks,
- Max K.
ZRXUSD trade ideas


Short Short ShortWho ever ran this pump made 65%.
I am Shorting.
Do not trade by my word. Trade at your own risk.


ZRX To 0.28?? Another H&S Pattern forming Hope all of you are well and staying safe! Don't forget to social distance! 🧍🏽♂️--(6ft)--🧍🏽♀️
Looking at the chart, my last analysis was short. But looking at the 1 day chart again with a fresh cup of joe, I am long. There is a Downward-Channel ZRX has been in for some time. This channel has replicated a head-shoulders pattern consecutively. Are we seeing another repeat of this trend? The RSI is clearly showing exactly the same pattern as every H/S prior, as well the moving averages have crossed at exactly the same time in the forming H/S as the one before it. So it seems there might be a repeat for the fourth time.
If we reach the top of the channel, the region that is red is where a sell off will occur, a good short position?? Possibly.
My prior analysis failed to see the bigger picture, so while only time will tell, I feel far more confident in this analysis than the last.
Just an interesting thought, let me know what you guys think! Please do not trade based on this idea.
Thanks for reading!
- Max K.

Possible H&S ??Looking at the day chart, a H&S pattern might be forming. This seems to be supported by a high RSI.
What do you all think?
- Max K.

OX / U.S. DOLLAR (ZRX / USD) DailyDates in the future with the greatest probability for a price high or price low.
The Djinn Predictive Indicators are simple mathematical equations. Once an equation is given to Siri the algorithm provides the future price swing date. Djinn Indicators work on all charts, for any asset category and in all time frames. Occasionally a Djinn Predictive Indicator will miss its prediction date by one candlestick. If multiple Djinn prediction dates are missed and are plowed through by same color Henikin Ashi candles the asset is being "reset". The "reset" is complete when Henikin Ashi candles are back in sync with Djinn price high or low prediction dates.
One way the Djinn Indicator is used to enter and exit trades:
For best results trade in the direction of the trend.
The Linear Regression channel is used to determine trend direction. The Linear Regression is set at 2 -2 30.
When a green Henikin Ashi candle intersects with the linear regression upper deviation line (green line) and both indicators intersect with a Djinn prediction date a sell is triggered.
When a red Henikin Ashi candle intersects with the linear regression lower deviation line (red line) and both indicators intersect with a Djinn prediction date a buy is triggered.
This trading strategy works on daily, weekly and Monthly Djinn Predictive charts.
This is not trading advice. Trade at your own risk.


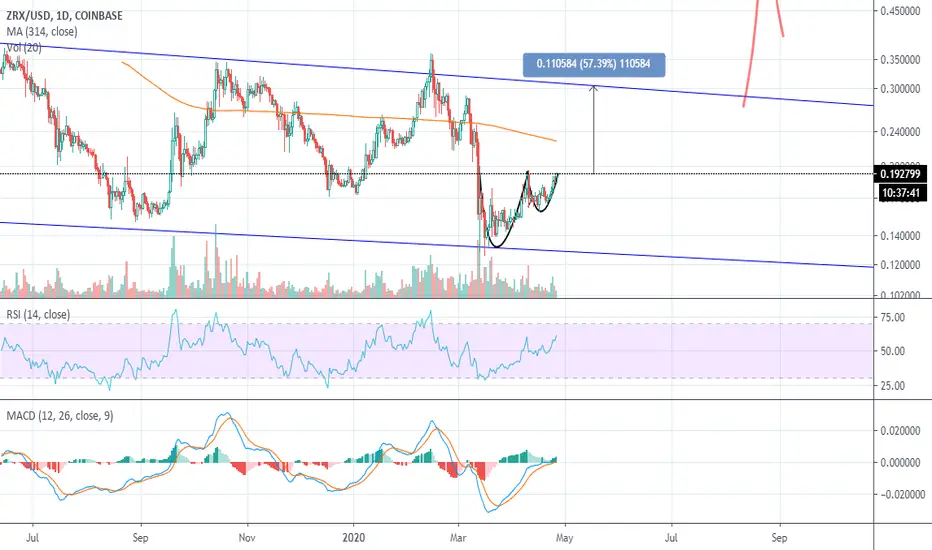
zrxusd longReversal cup and handle pattern formed.
Things could be going very high from here.
Not a financial advice. GOod luck with your trades :)

ZRXUSD 2d speculative setup 100% gains(NEW)before we kick start the update. your upvotes/subs are appreciated.
Why get subbed to to me on Tradingview?
-15+ years real live trading experience
-TOP Author on TradingView
-professional chart break downs
-key levels
-no junk on my charts
-frequent updates
-covering FX/crypto/US stocks
-24/7 uptime so constant updates
So without further due. Keep it short/simple and to the point.
ZRXUSD 2d speculative setup 10% gains(NEW)
ZRXUSD daily chart looks bullish, currently
sideways price action, however expecting
a new strong push soon.
Previously we had a false breakdown of the
key level, however price recovered and
is trading above this level. this is
a strong indication that bottom is set
already.
Overhead, we got a key S/R level @ 3350
which is a confirmed S/R level 3 tests,
so if price is set to re-test again, it's
a 100% gain from current levels.
recommended strategy: BUY/HOLD.
TP bulls is +100%. this is BUY/HOLD setup.
good luck traders!
get subbed to stay tuned for all the latest updates.
also add likes to support my efforts, thank you.

ZRXUSD bull run pending 100%/150% gains(NEW)before we kick start the update. your upvotes/subs are appreciated.
Why get subbed to to me on Tradingview?
-15+ years real live trading experience
-TOP Author on TradingView
-professional chart break downs
-key levels
-no junk on my charts
-frequent updates
-covering FX/crypto/US stocks
-24/7 uptime so constant updates
So without further due. Keep it short/simple and to the point.
ZRXUSD bull run pending 100%/150% gains(NEW)
IMPORTANT: this is a speculative setup, performance
is not guaranteed, so please use a tight stop loss.
and always do your own due dill. thank you.
Ok guys, how are you doing today?
ZRXUSD weekly in spotlight right now.
Speculative bullish XABCD setup.
Best load spot bulls near 1120 end
of April 2020.
TP1 +100%. TP2 +150%.
this is BUY/HOLD setup.
don't expect miracle/overnight gains.
good luck traders!
get subbed to stay tuned for all the latest updates.
also add likes to support my efforts, thank you.

ZRX - Entry Accumulate longs near the 0.12-0.15 level. ZRX powers a solid foundation of decentralised trading applications - will be bumpy but one of the better longs in this market.

ZRXUSD - Bollinger bands compression - being long ?Trend context (in weekly)
From April 2019, we are in a descending range.
We are currently at the bottom of this range (the pattern already happened twice in this range).
Technical analysis (in daily)
Bollinger bands are horizontal: volatility is stable but we can expect a move up or down.
I would go for a big move up (I’m also expecting a big volumes candle, as it’s decreasing since middle of March constantly).
RSI is in sellers zone (< 45), but I would expect end of the “sellers time" which lasts since beginning of March.
Order type BTC price ($) Profit (%) K used for trade (%)
BUY 0.164653 100%
TP 1 0.168552 2.37% 25%
TP 2 0.228692 38.89% 25%
TP 3 0.281981 71.26% 25%
TP 4 0.348305 111.54% 25%
SL 0.159498 -3.13% 100%
Hedging SL 0.16 -0.79% (if TP 1 is taken, this is our new SL. If this SL is hit, we won't loose any capital in this trade)
PS: I took the COINBASE ZRXUSD chart because the descending range is clearly visible on this one, but I will enter in this trade on BINANCE ZRXUSDT with almost the same entry and profit prices.

Two Chart PatternsA symmetrical triangle and a bearish pennant.
Symmetrical triangle is a bullish continuation chart pattern, while a bearish pennant as the name suggests is a bearish reversal pattern.

ZRXUSD 200% gains next bull run(NEW)before we kick start the update. your upvotes/subs are appreciated.
Why get subbed to to me on Tradingview?
-15+ years real live trading experience
-TOP Author on TradingView
-professional chart break downs
-key levels
-no junk on my charts
-frequent updates
-covering FX/crypto/US stocks
-24/7 uptime so constant updates
So without further due. Keep it short/simple and to the point.
ZRXUSD 200% gains next bull run(NEW)
IMPORTANT: this is a speculative setup, performance
is not guaranteed, so please use a tight stop loss.
and always do your own due dill. thank you.
Tagged as SHORT as short-term I expect more losses
before reversal/dump.
ZRXUSD 4d Coinbase. Potential/speculative setup.
potential bull run off the lows 200%+ gains.
good luck traders!
get subbed to stay tuned for all the latest updates.
also add likes to support my efforts, thank you.


ZRXUSD 2d speculative setup 200% gains (NEW)before we kick start the update. your upvotes/subs are appreciated.
Why get subbed to to me on Tradingview?
-15+ years real live trading experience
-TOP Author on TradingView
-professional chart break downs
-key levels
-no junk on my charts
-frequent updates
-covering FX/crypto/US stocks
-24/7 uptime so constant updates
So without further due. Keep it short/simple and to the point.
ZRXUSD 2d speculative setup 200% gains (NEW)
IMPORTANT: this is a speculative setup, performance
is not guaranteed, so please use a tight stop loss.
ZRXUSD could be an IHS setup on 2D chart, keep in
mind this is speculative, so use tight stop loss at all
times. Back to the setup. IHS head print near 10000/11000
later in April 2020. Neckline near 34000, so it's 200% gain
from low until the neckline.
good luck traders!
get subbed to stay tuned for all the latest updates.
also add likes to support my efforts, thank you.

ZRX- TECHNICALS ARE BULLISH - Altcoin TAHey there,
Please support this post with consistent likes and make sure you follow me on TV if you don't want to miss out!
So this is a bit different that what I ususally do. Normaly I don't post any charts of smaller cap altcoins and only
refer to the bigger ones, such as Litecoin and Ethereum.
Nonetheless, ZRX price movements look quite promising and have a strong bullish bias.
As you can see on the chart, we have consistent higher lows on the weekly timeframe and are forming a
horizontal resistance line at the the top at $0.37. It already looks much like an ascending triangle, which
is a pattern which I trade often and like the most for bullish action.
The moving averages aren't looking too significant on this chart since they are mostly moving through price
on the daily timeframe.
Also there is a critical support area down below at 0.156$ which definitely has to hold, if ZRX wants to see
growth over the next altcoin cycle.
That is actually the main point here. Will we see another altcoin-cycle or are all smaller cap altcoins doomed
for eternity? Well of course Bitcoin needs to be in an uptrend for ZRX to move higher, but since this is a
clear bullish structure for now, I think it will be a cleaner and stronger play, if the next altcoin cycle arrives!
So far so good!
Cheers,
Konrad

ZRX (0x) vs USDThis chart has so many bullish indicators...
1) Life cross on February 12th with re-tracement and support to the 200-day Moving average
2) Support on the Fibonacci 0.618
3) RSI support trend following an oversold period
4) weekly chart. Previous resistance now acting as support

0x (ZRX)This one is facing a case of old support becoming new Resistance
Only buy break above old support (red line)
And use the line as a stoploss
Bearish

