ZRXUSD trade ideas

zrx back to previous support, before continuation?touched resistance at .31
bear div on macd and rsi
maybe retest new support at .29, or it will bounce before that.
if market goes up, zrx has a lot of upside potential after a short term dip possibility

accumulation.good time to invest
I'm not an investor
will update waves for trading in comments
there's likely time


ZRXUSD retrace watch again: 0x hit targets and is pulling backZRX made another wave up, which finished exactly at a 5.618.
The pullback so far resembles and ABC correction, staring C now.
Green zones represent support zones to watch for possible bounce.
Previously I was looking for a retrace to enter, which I did per this plan: the above long was executed with a "Ladder" of limit buys between the two support zones.


ZRX Swing TradeZRX has been in an accumulation phase, with majority of other ALTS for the past 3 months, and now primed for public participation to pump higher. If ZRX breaks above, and establishes support, at $.28 I believe that It would surge higher. If that is the case, $.30 then $.34 should be met over the next 1-2 months. Not too get overly excited but if we see sustained momentum through the $.36 resistance, the $.40 region should follow soon after.

ZRX 0x Buying OpportunitiesBullish divergences on both charts, and good entry.
Take profits at
15%
30%
60%
70%

ZRXUSD retrace watch: 0x impulse done, retrace to where ?Quick plot to observe ZRX retrace.
There was picture perfect 12345 impulse.
And per Elliott, next comes an ABC correction.


Re-entered ZRX on the falling wedge trend-line.If ZRX can get back into the channel and close a daily candle inside, prepare for moon launch.
Fib Retracement on ZRXUSD - PoloneixAfter putting on the fib retracement on current ZRX chart, we can see that target one on price prediction is at 29 cents and target 2 is at around 30.4 cents. 3.3.2019

ZRX showing history of 50% retracement as resistanceIf we see movement to the upside soon, $0.55 will be a price range to target.

ZRX - what is coming in the next few months?Monthly - we can see this mass deceleration to the downside, which in last month we finally closed as a doji - perhaps this month or next will be the beginning of the bull run???
S&P is approaching a very very very responsive and critical resistance zone, worries about a market crash linger more and more each week, and we actually close as a doji weekly candle stick right near the zone. So what we may see is the decline to begin already, or to move higher in the next few weeks into the zone, giving us a confirmation candle right after indicating sell sell sell. In hopes, the crash of S&P with give us the complete opposite for the cryptos, e.g. ZRX and XRP etc. May the bull run for the cryptos rain upon us very soon!!!!!!!

The Little Coin That CouldJust like the Little Train That Could, ZRX is saying "I think I can, I think I can." If this candle closes above the 20 MA of the Bollinger Band it might hit it's target after all.

ZRX Swing TradeIf we can see a bounce to the top of this expanding channel, I believe we may see a further breakout to the upside. If the $0.269 pivot is broken, with a daily closure above, the upside $0.30 and $0.32 levels will likely be met in the medium term.


ZRX CoinbaseUsed to think I knew what I was doing. Publishing this for my own documentation. Probably don't follow my lead

0x - a trend is your friend0x has returned to the trend line it created over a year ago after a 92% collapse in price. This is a project to watch going forward regarding decentralised exchanges. The 3-day chart shows an impressive volume increase matched only to that prior to the last rally. The downward channel created throughout 2018 is very clear, can't think of a better moment to get exposure to this project as we linger in the bottom of this channel. The weekly chart is just as exciting, the angle of the crossing Stochastic RSI indicators is sharper than that previously made before the last rally.


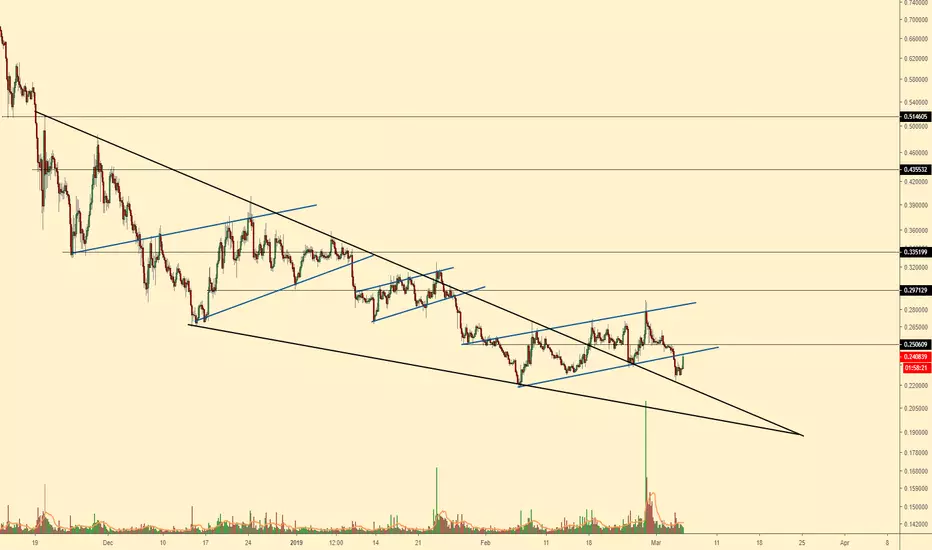
Trend reversal?The price is moving against the upper line of the falling wedge. On a smaller timescale, an ascending triangle is formed which is a bullish sign. A breakout of the falling wedge and the ascending triangle will be bullish. There a two possible buy zones to look for, take profit around the 0.30 range. Stop loss should be below the previous low.
