A bounce back is imminent for ZRX.#ZRX/USDT #Analysis
Description
---------------------------------------------------------------
+ The price is heading towards the support zone after reaching a local high.
+ The price is expected to consolidate in this support zone and bounce back from it. It's highly unlikely that the price will go lower than this.
+ If the price bounces back from this support, we can expect it to reach the previous ATH in this bull run.
---------------------------------------------------------------
VectorAlgo Trade Details
------------------------------
Entry Price: 0.2959 - 0.3224
Stop Loss: 0.2461
------------------------------
Target 1: 0.3889
Target 2: 0.5293
Target 3: 0.7136
Target 4: 1.1567
Target 5: 1.6046
Target 6: 2.0365
------------------------------
Timeframe: 1W
Capital Risk: 1-2% of trading amount
Leverage: 5-10x
---------------------------------------------------------------
Enhance, Trade, Grow
---------------------------------------------------------------
Feel free to share your thoughts and insights.
Don't forget to like and follow us for more trading ideas and discussions.
Best Regards,
VectorAlgo
ZRXUSDT trade ideas

Technical Analysis of ZRXUSDT.PCurrent Price Analysis: The current price of ZRXUSDT.P is 0.3533, which is below the middle Bollinger Band (0.3679). This suggests that the asset is currently in a lower price range compared to its recent average.
Volatility and Price Change: The average price change of 1.5% indicates moderate volatility. Given that the current price is close to the resistance level (0.3560), it may suggest a potential upcoming test of this price level.
Bollinger Bands Interpretation: The price is situated between the lower (0.3105) and middle (0.3679) Bollinger Bands. This positioning often indicates a neutral to bearish market sentiment, with potential for movement in either direction.
Support and Resistance Levels: The support level at 0.3301 has not been breached, indicating that there might be a strong buying interest above this price. The proximity of the current price to the resistance level suggests that the market is testing the selling pressure.
Overall Market Sentiment: Considering the provided data, the market sentiment appears cautiously optimistic, with the price maintaining above the support level and near the resistance, indicating a possible breakout if the resistance is surpassed with significant volume. However, caution is advised as resistance levels can often lead to price reversals if not broken. Always consider market trends and other economic factors in conjunction with technical analysis before making trading decisions.
Disclaimer:
This analysis is for informational purposes only and should not be considered financial advice. Trading cryptocurrencies involves significant risk, and you should consult with a qualified financial advisor before making any investment decisions.

#OX/USDT#OX
The price is moving in a bearish channel on a 4-hour frame and is holding it strongly and is about to break it upward
We have a bounce from the green support area at 0.3100
We have a tendency to stabilize above the Moving Average 100
We have a downtrend on the RSI indicator that is about to break higher and supports the rise
Entry price is 0.3475
The first target is 0.3990
The second target is 0.4357
The third goal is 0.4811

zrxWe are currently moving in this yellow box. If it is supported in the box, we can expect to move up to the dynamic resistance and then up to the ceiling of the box and the specified points. The supported opinion can go to the green lines

ZRXHi
BINANCE:ZRXUSDT
Broken from above of the falling wedge, expecting a LARGE movement to the upside from here
Buy zone:40 to 55
Targets:54-58-74
thank you follow me

ZRX - BuyA suitable position for #ZRX in the strong support range and the chance of price return with a fluctuation of about 10% from this area.

ZRXUSDT | TRADE (MAY 31st)Hello, I'm Minno , and welcome to my trading journey!
I began my trading adventure in the world of Forex. Those early days were a rollercoaster, marked by a series of losses with just a few fleeting moments of victory. Despite the challenges, I remained undeterred, always seeking ways to improve and learn from my experiences.
After a few years, I decided to pivot and immerse myself in the exciting world of cryptocurrency. This decision wasn't just about finding a new trading arena; it was driven by my deep interest in the technology that underpins cryptocurrencies. The decentralized nature, the innovative applications of blockchain, and the vibrant community all fascinated me.
In the realm of crypto trading, I engage in both swing trades and day trades. This dual approach allows me to capitalize on short-term market movements while also taking advantage of longer-term trends. Each day in the crypto market presents new opportunities and challenges, and I'm constantly honing my strategies to stay ahead.
My journey is ongoing, and I invite you to join me. Whether you're a seasoned trader or just starting, I hope my experiences and insights will provide you with something valuable. Stay tuned for tips, strategies, and updates from the ever-evolving world of crypto trading. Here's to learning and growing together!
1. ZRXUSDT
Let me share with you my first trading idea: a swing trade for ZRXUSDT , one of my favorite breakout setups.
For this trade, I'm focusing on an easy breakout trade, a strategy I particularly enjoy due to its simplicity and effectiveness. Here’s how I approached it:
Multi-timeframe Analysis
One of the keys to successful trading is a thorough multi-timeframe analysis. By examining different timeframes, I can get a comprehensive view of the market trends and potential breakout points.
Step-by-Step Process
Identify Key Levels: First, I identify the critical support and resistance levels on the higher timeframes. These levels serve as my guideposts for potential breakouts.
Look for Patterns: I look for patterns that signal potential reversals or continuations. Recently, I noticed a double bottom pattern forming within our support zone on the ZRXUSDT chart.
Confirm the Breakout: Once the pattern is identified, I wait for a confirmation of the breakout. This typically involves a close above the resistance level for a long trade.
Entry and Risk Management: After confirmation, I enter the trade with a well-defined stop-loss below the recent support to manage risk. Position sizing is crucial to ensure that even if the trade doesn’t go as planned, the loss is controlled.
Current Trade Setup: ZRXUSDT
Recently, ZRXUSDT formed a double bottom pattern within our identified support zone. This is a strong bullish reversal signal, indicating that the downtrend might be coming to an end.
- Support Zone: The double bottom formed in a robust support zone, reinforcing the potential for an upward breakout.
- Entry Point: Upon confirming the breakout above the neckline of the double bottom pattern, I decided to go long.
- Targets: My primary target is the next major resistance level, with a secondary target further up if the momentum continues.
- Stop-Loss: My stop-loss is placed just below the support zone to protect against any unexpected downward moves.
I’m excited about this trade and believe it has great potential given the current technical setup. Stay tuned for updates on how this trade unfolds and remember, every trade is a learning opportunity. Let’s see where this journey takes us!

ZRXUSDT | Continuation?ZRXUSDT Trade Analysis
My previous ZRXUSDT trade didn't pan out as expected, but I'm still bullish on this one. I've just opened a new position that could unfold over the next few months.
Weekly Chart
Despite a recent breakdown, we're holding steady at the previous weekly high and have bounced back nicely. This resilience suggests potential for an upward continuation.
Trade Setup
I'm targeting an easy continuation with an impressive 5:1 risk-reward ratio. This setup offers a fantastic opportunity for a strong comeback, and I'm excited to see how it plays out.
Stay tuned for updates—this could be the trade that turns things around!
#CryptoTrading #ZRXUSDT #Bullish #TradingStrategy #MarketAnalysis #HighRiskHighReward #StayTuned

ZRXUSDT.1DExamining the chart of ZRX/USDT from the daily timeframe, here is my technical analysis:
Price Action and Structure:
The price of ZRX/USDT appears to have established a consolidation phase within a specific price range. Notably, there are recurring lows around the same level, marked as 'T' on the chart, suggesting strong support around these areas. The price has made several attempts to rally but faced resistance, depicted as 'R1' and projected future resistance 'R2'.
Technical Indicators:
RSI (Relative Strength Index): The RSI is currently at 53.60, which is neutral, suggesting that there is neither excessive bullish nor bearish momentum. However, it's approaching the mid-line from above which might suggest a potential strengthening in momentum if it maintains above this mid-line.
MACD (Moving Average Convergence Divergence): The MACD line is slightly above the signal line but both are near zero. This indicates a minimal bullish momentum as of now. The convergence between these lines is something to watch, as further divergence or a crossover can suggest an increase in momentum in either direction.
Support and Resistance:
The key support level, denoted as 'S1', needs to hold to prevent any bearish reversal. It's crucial as a fall below this level could accelerate selling pressure.
Resistance levels 'R1' and the anticipated 'R2' are critical for the price to overcome to confirm a bullish trend. The level marked 'R2' at 0.7702 is quite ambitious and suggests a strong bullish scenario if 'R1' is decisively broken.
Projection and Strategy:
The projected path drawn on the chart indicates an expectation of a rise towards 'R1', retracement, and then a potential test of 'R2'. This bullish outlook would be contingent upon the price maintaining above 'S1' and the RSI staying above the mid-line, suggesting sustained buying pressure.
Conclusion:
As a trader, I would look for confirmation of support holding at 'S1' along with bullish signals from both RSI and MACD before considering a long position. It would be prudent to set a stop loss just below 'S1' to mitigate risk. On the upside, breaking above 'R1' could open the way towards 'R2', presenting a significant trading opportunity. However, any trading should be approached with caution and aligned with broader market conditions and news affecting the cryptocurrency market.

ZRX/USDT to test the Resistance line at 0.5977Daily chart, I see a trading opportunity between the 2 lines Resistance R and Support S
The MACD indicator is supporting more probability that the crypto will test 0.5977 this month.
Be careful with the crypto volatility.
Stop loss below 0.4400 should be considered.
After crossing R, the target will be 0.7627

ZRXUSDT.P TECHNICAL ANALYSISDaiily Chart Analysis:
Current Price: $0.5622
Resistance: $0.5953
Support: $0.5327
Trend: No clear trend detected
Bollinger Bands (21, 2):
Lower Band: $0.4110
Basis (Middle Band): $0.5155
Upper Band: $0.6200
Interpretation:
The current price ($0.5583) is above the Bollinger Bands basis ($0.5155) but below the upper band ($0.6200), suggesting a moderately bullish stance as it is closer to the upper band.
Price is between the support level ($0.5327) and resistance level ($0.5953). The immediate support is relatively close, providing a safety net for downward movement.
The lack of a clear trend indicates indecision in the market. Traders should watch for either a breakout above $0.5953 (indicating potential further bullish momentum) or a breakdown below $0.5327 (indicating potential bearish pressure).
4-Hour Chart Analysis:
Current Price: $0.5583
Resistance: $0.5559
Support: $0.5447
Trend: Short-term bullish trend detected
Bollinger Bands (21, 2):
Lower Band: $0.5428
Basis (Middle Band): $0.5598
Upper Band: $0.5768
Interpretation:
The current price ($0.5583) is very close to the Bollinger Bands basis ($0.5598) and just above the resistance level ($0.5559). This suggests potential upward movement but also caution as it approaches the resistance.
The short-term bullish trend indicates positive momentum on the 4-hour chart. If the price maintains above the resistance ($0.5559), it could test the upper Bollinger Band ($0.5768) and potentially move higher.
Support at $0.5447 provides a nearby level to watch for any potential retracement.
Combined Analysis:
Daily Perspective: Neutral to moderately bullish, with the price between key support and resistance levels and above the Bollinger Bands basis.
4-Hour Perspective: Short-term bullish, with the price above the key resistance and close to the Bollinger Bands basis.
Trading Considerations:
Bullish Scenario: If ZRXUSDT breaks above the $0.5953 resistance on the daily chart with strong volume, it may confirm a longer-term bullish trend. On the 4-hour chart, maintaining above $0.5559 could signal further upward movement toward $0.5768 or higher.
Bearish Scenario: If the price falls below $0.5327 on the daily chart, it may indicate a potential bearish trend. On the 4-hour chart, a breakdown below $0.5447 could lead to a test of lower Bollinger Bands and support levels.
Given the current price dynamics, monitoring both the daily and 4-hour charts for confirmation of trend direction is essential. A close above or below the mentioned resistance/support levels with significant volume could provide clearer trading signals.
Disclaimer:
This analysis is for informational purposes only and should not be considered financial advice. Trading cryptocurrencies involves significant risk, and you should consult with a qualified financial advisor before making any investment decisions.

LongAccording to the waves analysis we can expect that price rise again to the green zone.
This is my personal opinion and is not an offer to buy or sell, please act according to your trading plan

ZRXUSD 1WZRX ~ 1W 📈
#ZRX Retesting of the Support Line and S/R Block has been successful. NEWCONNECT:ZRX is still bull for the long term.

ZRX is breaking out on Daily TFBINANCE:ZRXUSDT
ZRX is breaking out
You can buy @ cmp till $0.50
TPs are mentioned on Chart.
Thanks Like & Follow

$ZRX #0xProtocol Trading IdeaZRX/USD (0xProtocol) formed a descending channel on 12h-1d timeframes. Money flow tries to curve back up. After a clear breakout potential target would be $0.65-$0.80-$1.15.

ZRX ANALYSIS💥💥#ZRX Analysis 🚀🚀
#ZRX is breaking out of a falling wedge pattern on 12HR timeframe👀
We are expecting more than 100% movement in first run✈️ 💸
👀Current Price: $0.5318
🚀 Target Price: $1.4388
⚡️What to do ?
👀Keep an eye on #ZRX price action and volume. We can trade according to the chart and make some profits⚡️⚡️
#ZRX #Cryptocurrency #TechnicalAnalysis #DYOR


$ZRX BREAKOUTNEWCONNECT:ZRX breaks out of the decending falling wedge.
Huge pattern with a lot of upside potential!

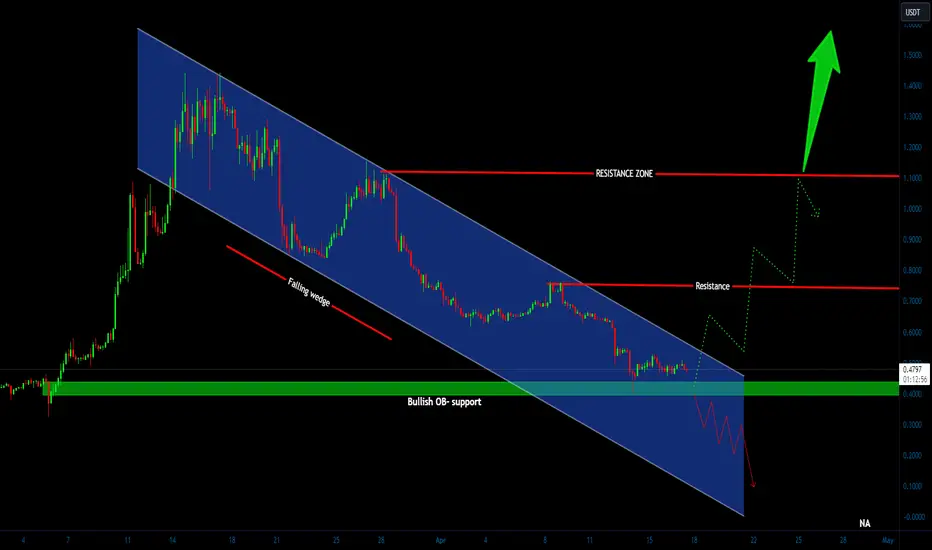
ZRX/USDT showing a bounce and potential back to upward move!💎 The recent market dynamics surrounding #ZRX have indeed been quite notable. Currently, ZRX is bouncing from the Bullish OB and is poised to test the resistance of the descending channel.
💎 If successful in breaking the pattern, the next challenge will be to breach the key resistance area at 0.618.
💎 This level is crucial for confirming a bullish reversal, and ZRX must surpass it to signal a return to bullish sentiment. If achieved, the price may target a test of the strong resistance area.
💎 However, if ZRX fails to break above the 0.618 resistance level and faces rejection, it could lead to a downward movement, potentially retracing to test the Bullish OB for new momentum.
💎 It's essential to monitor ZRX's behavior at the Bullish OB level. A successful bounce from this level would reinforce bullish momentum. Conversely, a failure to bounce, or a breakdown below the OB area, could signify a bearish trend continuation, resulting in further downward movement.
MyCryptoParadise
iFeel the success🌴

ZRX/USDT falling wedge what next? 👀ZRX analysis💎 Paradisers, get ready for an intriguing ride with ZRXUSDT! The current price action closely adheres to a falling wedge trajectory. If the price maintains momentum at the bullish order block (OB) and key support $0.3942, we can anticipate a bullish ascent toward the strong resistance level.
💎 However, let’s also consider an alternative scenario: Should the price drop below the key support within the falling wedge, it’s time to act wisely. As savvy traders, we’ll take a downward position because selling pressure has overcome buyers, capitalizing on the recent market uncertainty.
💎 For newcomers tempted to go long, remember to stay vigilant and anticipate market movements. Being one step ahead can make all the difference!
MyCryptoParadise
iFeel the success🌴
Long trade
12th April 2024
3rd Entry (Long trade)
3:00pm New York Session
Entry: 0.5155
Profit level: 0.6103 (18.39%)
Stop level: 0.5027 (2.48%)

Short trade
Part 2
12th April 2024
11:45am New York Session
Entry: 0.6148
Profit level: 0.5796 (5.73%)
Stop level: 0.6197 (0.80%)

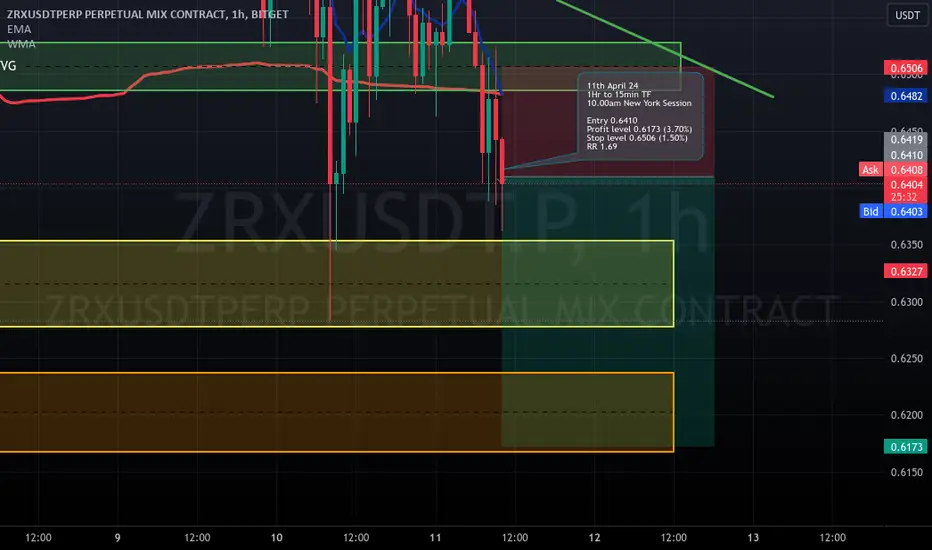
Short trade
Currency Pair: ZRXUSDT
Date: April 11th, 2024
Timeframe: 1-hour to 15-minute
Session: New York (10:00 AM)
Entry: 0.6410
Profit Target: 0.6173 (3.70%)
Stop Loss: 0.6506 (1.50%)
Risk-Reward Ratio (RR): 1.69