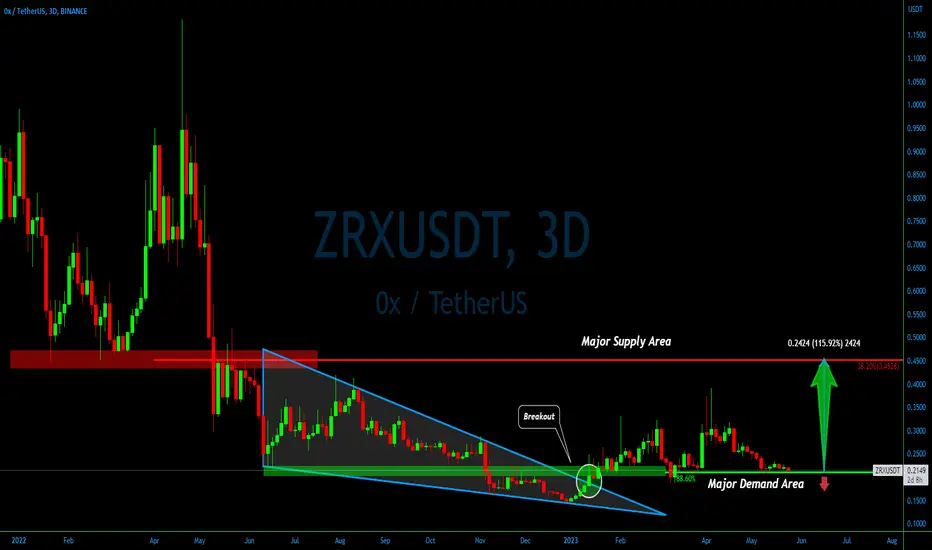
Breakout from the Wedge: #ZRXUSDT Signals Potential 115% Gains💎Earlier this year, #ZRXUSDT broke above the Falling Wedge pattern, signaling a potential uptrend. The subsequent formation of higher highs and higher lows further reinforces bullish outlook.
💎In recent weeks, #0X has been consolidating just above the 88.6% Fibonacci support, aligning with a significant supply/demand zone established over the past year. As long as we maintain a daily close above the 88.6% Fib level, the stage is set for a remarkable price surge of over 115% in the weeks ahead.
💎Our attention now turns to the nearest major resistance and supply area near the 38.2% Fibonacci retracement. This presents a key target for potential gains.
💎While it's essential to acknowledge the current downtrend visible on the daily timeframe, it becomes paramount to closely observe the price action around the current support. MCP team is eagerly watching for signs of strength and confirmation.
💎Stay tuned, Paradisers! We'll be keeping a close eye on the developments and providing you with timely updates on #ZRX. Let's navigate this market together and seek those opportunities for success.
ZRXUSDT trade ideas
Ox (ZRX) formed bullish Gartley for upto 90% rallyHi dear friends, hope you are well and welcome to the new trade setup of Ox (ZRX) token with US Dollar pair
Previously I shared a long-term trade setup on a monthly time frame, unfortunately the priceline broke down a long-term support of $0.30 but it is still moving in the potential reversal zone and can start a massive move from here.
Now on a smaller (weekly) time frame, ZRX has formed another bullish Gartely pattern.
Note: Above idea is for educational purpose only. It is advised to diversify and strictly follow the stop loss, and don't get stuck with trade

ZRXUSDT TODAYPLZ DO NOT SELL MY SIGNALS
1-Apply your own risk management.
2-Daily and Weekly Targets
3-Hunt the profits at any level you see convenient for you.
4-Grey Zone for entry,
5-Orange Level Exit by OCO
6-Yellow levels are targets.
have a good day guys.

ZRX midtermhello dear trader
zrx in the uptrend channel
you can buy at dynamic suport and sell in the yellow resistance 😅
good luck❤️

Importance of Comparing Automated Trading Strategies to Buy&HoldImportance of Comparing Automated Trading Strategies to Buy&Hold | 04/15/23
Recently, TradingView introduced a new backtesting feature that allows traders to compare their trading strategy to simple "buy and hold" strategies. This has proven to be very useful for our trading team and crypto community, especially when attempting to find the best settings for manual and automated trading scripts, such as our Ninja Signals V4 script, so we wanted to highlight this awesome new feature.
In this example, we used TradingView's new 'Compare to Buy & Hold' feature to compare our chosen configuration settings for our Ninja Signals V4 automated trading script and backtesting strategy. As you can see, our chosen settings have performed significnatly better than simple "buy and hold" strategies over the last several years (compare the green strategy profit line to the blue "buy and hold" profit line).
This new TradingView feature is very powerful, because it helps traders determine if a trading strategy is more or less profitable than simply buying and holding. Just because a trading strategy produces some profit does not mean that it is worth trading, especially if simple "buy and hold" strategies out-perform your chosen trading settings.
The settings used in this chart performed well even the recent bear market. As you can see in the strategy statistics, as "buy and hold" strategies were losing profit, the settings we used for our Ninja Signals V4 trading script were actually gaining profit. This new TradingView tool improves our ability to find good settings for both manual and automated trading strategies, and gives additional confirmation that profitable trading settings are better than simple "buy and hold" strategies.
Furthermore, the settings we used in this chart have compounding turned off, meaning each trade is the same order size, without any reinvesting of profits. Even as our trading fund grows from this profitable trading strategy, we continue to simply place orders for the same amount each time, rather than re-investing profits to trade larger and larger amounts (known as "compounding"). If compounding is turned on, profits grow much faster, but that is beyond the scope of this publication.
We will publish a separate educational idea in the future about the importance of comparing "compounding" vs "non-compounding" settings when backtesting, but for the purposes of this chart, we simply wanted to share that we were able to achieve significant profits, even in a bear market, and even with no compounding (no reinvesting of profits).
In conclusion, the new TradingView "Compare to Buy & Hold" backtesting feature gives traders a powerful new tool to find better settings for their chosen trading strategy, and additional confirmation and confidence that live trading will be successful. We thank the TradingView team for adding this powerful new feature!

ZRX go down from trendlineAfter a strong growth and an update of the maximum of $ 0.3640, the price went into correction and formed a cascade of lows in short, the downward trend of movement + very small volumes remains, I expect a small trade on the current and perhaps another touch of the price to the downward slope, after which the seller's activity increases, the breakdown of the marked levels and the price movement to the nearest support zone

Ox (ZRX) formed bullish Cypher for upto 34% rallyHi dear friends, hope you are well and welcome to the new trade setup of Ox (ZRX) token.
Previously I shared a long-term trade setup for ZRX, which is stil in play as below:
Now on a 4-hr time frame, ZRX has formed a bullish Cypher move for another price reversal.
Note: Above idea is for educational purpose only. It is advised to diversify and strictly follow the stop loss, and don't get stuck with trade

ZRX Technical Analysis, Overbought or Bullish Trend?ZRX is currently trading at $0.3448, and on a 4-hour timeframe, we see an RSI of 70. This suggests that the price is currently overbought, and we may see a correction or consolidation soon. However, we shouldn't rely solely on RSI, as other indicators can provide more insight.
One such indicator is the Fibonacci levels. ZRX is currently trading above the 0.5 level at 0.3205, indicating a potential bullish trend. However, the price has not yet reached the 1.0 Fibonacci level at 0.3737, which may serve as a resistance level. It's important to keep in mind that Fibonacci levels are not the be-all and end-all of technical analysis, but they can be useful when used in conjunction with other indicators.
Speaking of other indicators, we can also look at the Bollinger Bands. ZRX is currently trading near the upper band at 0.3467, which may indicate that the price is overbought. Conversely, the lower band at 0.2571 may serve as a support level if the price were to drop. The middle band at 0.3019 can also indicate the overall trend.
The volume oscillator is currently at +7.15%, which may suggest that there is buying pressure in the market. Additionally, the MACD value is positive at 0.0150, indicating that the price may continue to increase. However, the stochastic oscillator is at 81.80, which may suggest that the price is overbought and could be due for a correction.
So, what does all this mean for ZRX? Well, we can't predict the future with 100% accuracy, but we can use these indicators to form a more informed opinion. While the RSI suggests that the price is overbought, the positive trends in the volume oscillator and MACD may indicate that the price will continue to rise. On the other hand, the high stochastic oscillator may suggest that we'll see a price correction soon.
When it comes to key prices, we can look at local support and resistance levels. A solid support level may be found at the lower Bollinger Band of 0.2571, while resistance may be found at the 1.0 Fibonacci level of 0.3737. It's important to keep an eye on these levels, as a break in either one could signal a change in the overall trend.
Overall, ZRX is an interesting asset to watch. By combining various technical indicators, we can get a better idea of where the price may be headed in the short term.

#ZRX Wait until wave 4 correction is completed to buyThe 1-hour time frame is completing a full cycle, which is currently in the 4th correction cycle. After completing this correction, it can complete the 5 ascending wave up to the specified area.

ZRX COIN PUMP 60% IN TWO DAYS , WHAT NEXT ?in last two days zrx coin almost pump opto 62%... and now currently trade at 0.33$.
if you buy this token few days ago then i recommand you that book your profit... becauze we did not see any important news and update behind this pump.
rsi and others indicators now look bearish om zrx token.
if you open position in short on zrx token btween 0.35-0.36$ then must use stoploss.
if you did not open any position in short then wait till its price reach at 0.40$ minimume.... and don't use upto 2% fund this coin .
1st support area 0.29$ & 2nd supprt area is 0.24$.
follow me for update about crypto.

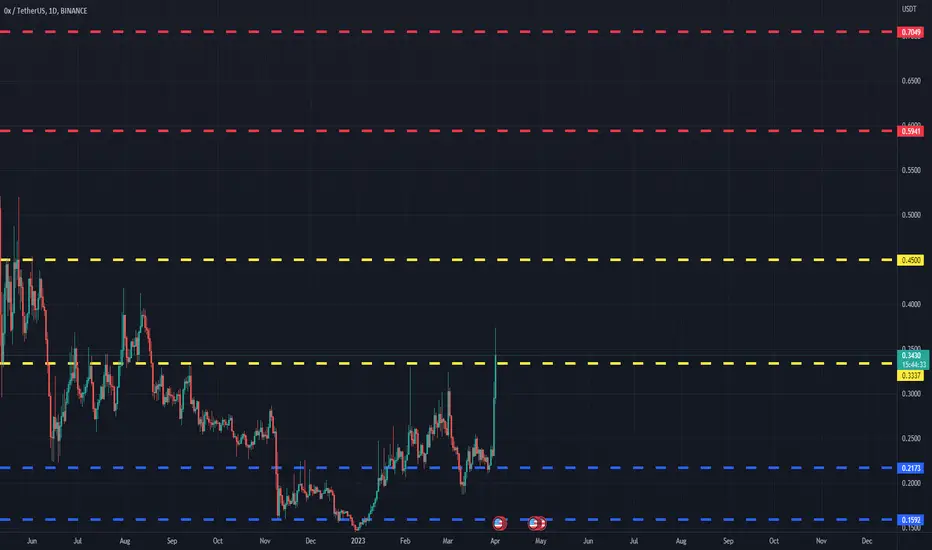
ZRXUSDT(0x) Daily tf Range Updated till 01-04-23ZRXUSDT(0x) Daily timeframe range. solid pump where btc dominance still high. a clean break from #0.3337 open a space till #0.4500. it got some decent volume now so its not that hard. if selling pressure takes over a failed break will lead it back to lower levels.
ZRXUSDT 52.86% ✅🚀#ZRXUSDT
we published and shared this idea with you in our profile here as you can check the previous analysis for #ZRXUSDT
and this analysis gave really good and massive profits
Target 1️⃣ : done✅
Entry price: 0.2410$✅
Price reached :0.3684$ ✅
Profit: 52.86% ✅🚀🚀🤑

ZRXUSDT trading inside weekly resistanceThe price is trading inside the weekly resistance. The structure looks bullish. However, the price is still inside the resistance zone, so a long is not favorable at this point. The short is also not favorable as the price has momentum and it can move upside erratically.

ZRX Protocol + RobinhoodRobinhood recently partnered with Polygon
Robinhood statistics: 70-80% of users have traded and used crypto at least twice.
In early 2022, Robinhood said it wanted to create its non-custodial cryptocurrency wallet. They believe in blockchain technology. It will allow the listing of many new tokens that were not possible to list on a custodial wallet because there is a listing procedure and it is a centralized application. At the same time, when Metamask and Uniswap are trustless, you can do anything there - Robinhood wants to have the same capabilities in their application. And for this, Robinhood recently launched its non-custodial wallet, and there is access to all assets on the Polygon (Matic). They have announced a beta version with opened access to only 10,000 users and hope to make the application public for all their users by the end of the year.
Interestingly, 1.5 million people have already subscribed to this wallet without some marketing. Just one post in Twitter and one notification in their app.
Robinhood has 22 million users, which is 5-times more than DeFi, and this is only one fintech company.
And we came to the most interesting.
Robinhood will use the ZRX protocol to trade across all DEXs in the range.
It will be a separate non-custodial wallet as a Metamask only from Robinhood.
It will be a full-fledged competitor to Metamask.
All trading will take place via the ZRX protocol.
Now about the ZRX protocol.
It is a senior project. ZRX is almost at the bottom and supports Ethereum, Optimism, BSC, Polygon, Fantom, Avalanche, Celo, and Arbitrum networks.
There have been many partnerships and quality updates in 2022. Read more blog.0x.org
ZRX governance token
85% of all the tokens are already on the market - that's good.
I bought this token for my medium-long-term portfolio.
Best regards EXCAVO

ZRX Profit is a Professional Forex and Finance HTML Template that suitable for business organizations like Forex Broker, Cryptocurrency Services, Investment Company, and Financial Services. Comes with 4 homepage variant and equipped with latest web technology including Sass for flexible and rapid customization.

ZRXUSDT 0x Project Possible Short setupZRXUSDT 0x Project Possible Short setup if trend line breakdown get confirmed.

zrxusdt cup and handle pattern zrxusdt target are shown on chart with stop loss trade is active and confirmed

ZRXUSDT needs to hold the key levelsZRXUSDT is currently testing a key level on the dynamic support and a static daily support at the 0.23$ area. Traders need to be cautious and wait for a clear reaction from this level before making any trades, as the volume at this level is currently low.
A breakout above the previous high at the 0.25$ area would confirm the bullish trend and signal further upward momentum. In order to confirm this breakout, it is important to wait for increased volume and a clear confirmation according to Plancton’s rules. If the price confirms the breakout, traders may consider opening a new long position, as this would indicate a continuation of the bullish trend.
–––––
Follow the Shrimp 🦐
Keep in mind.
🟣 Purple structure -> Monthly structure.
🔴 Red structure -> Weekly structure.
🔵 Blue structure -> Daily structure.
🟡 Yellow structure -> 4h structure.
⚫️ Black structure -> <= 1h structure.
Follow the Shrimp 🦐

ZRXUSDT ready to fly 🚀🚀#ZRXUSDT
as you can see at the chart 3 days chart time-frame we have very important and strong support zone that's give us a signals for long move i expect the price will fly to the target at the chart i expect there will be a correction move buy and hold it to the next targets at the chart will pump following Bitcoin ( BTCUSD ) MACD is showing bullish RSI showing bullish EMAs is neutral Ichimoku cloud is neutral ZELMA is showing uptrend-move Parabolic SAR is bullish Accumulation distribution is neutral


$ZRX - Long Swing Opportunity $ZRX - Long Swing Opportunity
Entry Conditions:
- Breakout of local trendline resistance
- Bullish Impulse Signal
- Increasing volume
- Bullish Divergence
- Bounce of 200EMA support

ZRX : THE BREAKOUT VIEWRecently, the cryptocurrency ZRX has shown an important confirmation that could potentially lead to a breakout to the target we have previously identified on our chart. Based on our analysis, ZRX has emerged as a possible breakout coin. We will be closely monitoring the trend of ZRX in the coming days.
The below chart yellow line shows the confirmation.

ZRX : INCREASE VIEWZRX seems interesting for increased views.
We will follow the coin to see the trend.
