TQQQ 15m chart double bottom and upside divergence on MACD. Quick trade I usually trade higher timeframes. Bought the AUg 9, 63 calls for 1.40
Interesting chart on DE its been toying with the top at around $170 for a while and pushing up to it today again. The MACD shows we should be down around $165. Not a big move down, bu the AUg 9 expiration 165 puts are at under a dollar so we'll grab a few for a pullback next week.
PGR looks to be rolling over from the double top at new highs. MACD diverging down and the slope seems to indicate PGR should be at just over $80. The pattern took 25 trading days and isnt as even a V-shape as we look for, but going to grab some July 19 80 puts just after the open today. Target to sell before end of the week.
CNX has this third bottom in place but MACD has diverged up, and prices moving up form the bottom. Options are few and far between as is common with lower priced stocks. Bought the stock 500 @ $7.14. Gonna see how this pans out, MACD says price should be at $7.42 or so. If we get close to $7.40 we'll sell.
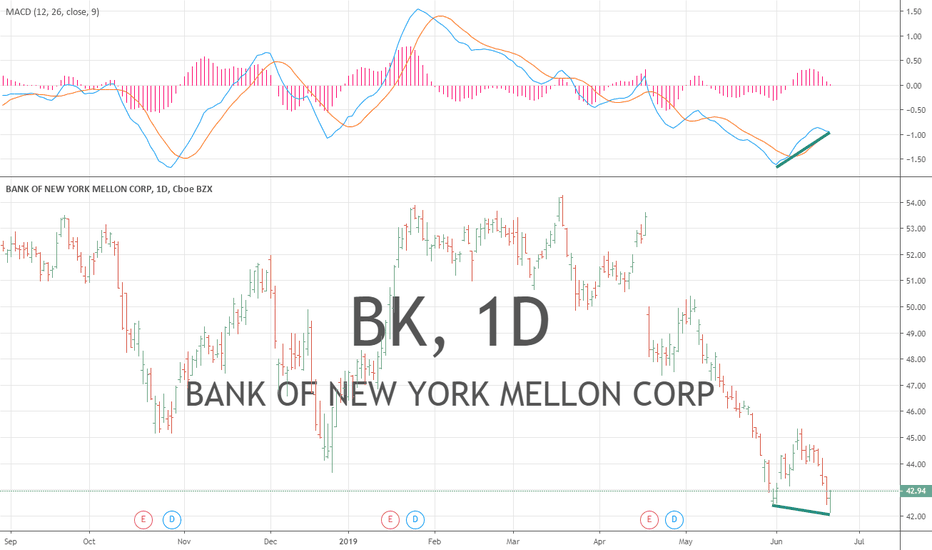
I like the look of this chart the clean double bottom and MACD divergence indicates prices should be around 44.5. Bought some June 28 43.5 calls for 39c
Watched this one the other day and when prices kept falling even with divergence up in place we put it the watch list. Gapping up today so hard to get in on options. But June 21 40.5 calls at .65c for a quick run up only 3 days until expiration.
Looks like theres some room for move up. its a 3x ETF so buying the ETF rather than options.
PHM turned out to be a good divergence to the downside with a topping pattern May 17, 2019. A new top is in place but the MACD is diverging even lower indicating price should be around 31.5. Trying some June 21 expiration 31.5 puts at .27.
Saw ADBE yesterday in this pattern MACD has been diverging down for some time. The MACD divergence indicates price should be at $275. OTM options are a taf expensive. June 21 expiration 267.6 puts are at 3.10. might be worth a couple of contracts.
DIsney showing a modest downside MACD divergence on daily charts. MACD indicates price should be $130 ish gonna try a few June 21 , 2019 130 puts trading between .16 and .17. 15 minute MACD diverging down nicely too.
AMGN has a small daily double bottom and MACD divergence so with the weekly chart still strong down this would be a short term trade. MACD seems to indicate price sb about $172, so bought some Jun 14th expiration 172.5 calls for 1.58. Probably hold for a few days max.
The MACD divergence on the long term chart of TRV indicates prices should be near the $128 level. The topping pattern forming on the daily seems to add credibility that this move is over. The daily chart closed near the low today and the MACD on daily is diverging down. Those who follow other time frames will note the weekly while in a large double top too of...
The May 24 expiration 107 calls are under a dime, spread is bit wide and the Mqy 31 expiration 107 calls again spread wide .16 - .20. Im gonna grab 100 shares of the ETF for a short term move and throw stops very tight just under $106
GLD double bottom and upside MACD divergence in place, have picked up some MAy 31 expiration $121 calls at 0.42. MACD says price should be around $121.5.
Reasonable pattern and the start of the downturn today I've nabbed a few of the May 24th 31.50 puts at .20 for quick trade
Watched this develop last few days some upside potential maybe left in this one the May 17, 2019 235 calls i looked at this morning at around $0.45 moved up to as high as $0.90 today.
ALGN formed a 10-day double top, MACD diverging down. Will look at options first thing Friday May 17, 2019 MACD says price sbaround $315. OTM May 24 315 puts traded at close on May 16 around $1.65.
A double bottom with an upside divergence in the MACD is taking shape. might be tad early but TBT is the leveraged ETF on the 20 year Treasury. Bought 10 contracts of the 33.5 puts expiring MAY 24 AT .09C BIT SPECULATIVE WE'LL SEE.


