Hi tradars! Based on the DXY index, considering the deep overbought conditions on the 4-hour timeframe and the reversal of indicators on the 1-hour timeframe, we can assume that subwave ((iii) within the larger third wave has now been formed. It reached approximately 100% of subwave ((i)), and in the coming week, we expect the development of wave 4. After that,...
Hi All! The current wave outlook for EUR/USD suggests that the third subwave within the larger third wave has likely been completed. In the coming days, we expect a correction, with the most probable target around 1.0680, potentially dipping slightly lower to 1.0620. After that, the euro is expected to resume its uptrend within the fifth subwave of the third...
Hi All! Last week, the euro continued its correction after a strong impulse, which is identified as subwave 3 within wave 3 of a higher degree. A technical correction occurred at the end of the week, and now the key question is whether it has been completed. 📍 Key Levels: ✅ 1.08600 – A breakout will confirm the end of the correction and open the way toward...
Hi All Gold remains bullish and could update its all-time high as part of subwave 5 within wave 5 of a higher degree. With a stop-loss around 3000, we can expect a price movement toward the 3100-3160 zone. Using various Fibonacci extensions, we can estimate that gold’s potential target is around 3160, and under certain fundamental conditions, the price could...
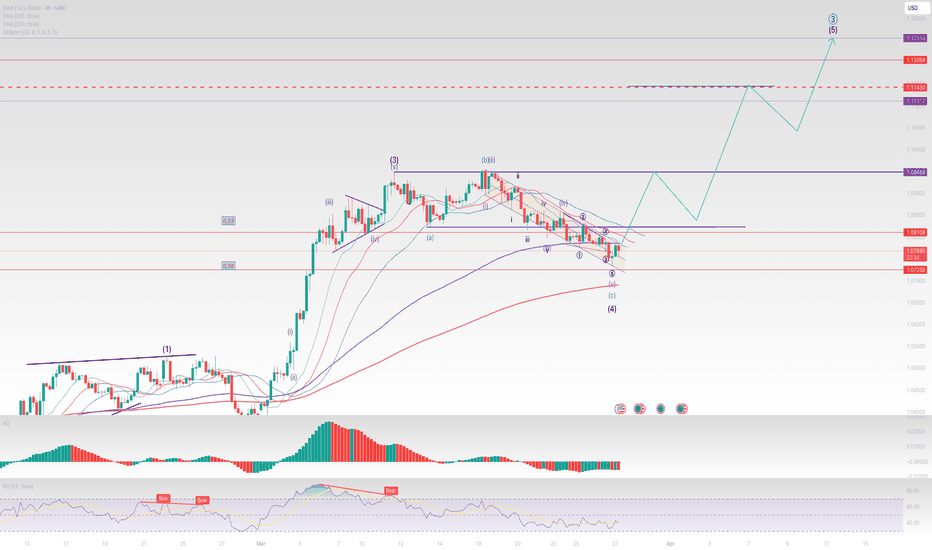
Hi Traders! Since March 18, EURUSD has been moving within a descending parallel channel, with its boundaries holding the trend in place. Yesterday, we saw a bounce off the lower boundary of the channel, accompanied by: ✅ A correction reaching 38% Fibonacci of subwave 3 ✅ Wave C of the expected horizontal correction (wave 4) reaching 1.68 of wave B 📊 What Does...
Hello, traders! Let’s analyze the current wave structure of the NASDAQ index. At the moment, there is a high probability that the index is forming wave C of a correction. Most likely, this is a horizontal expanded correction. ✅ Sub-wave 1 of wave C has already formed. ✅ Sub-wave 2 is also likely completed. On Friday, the index showed a strong decline and closed...
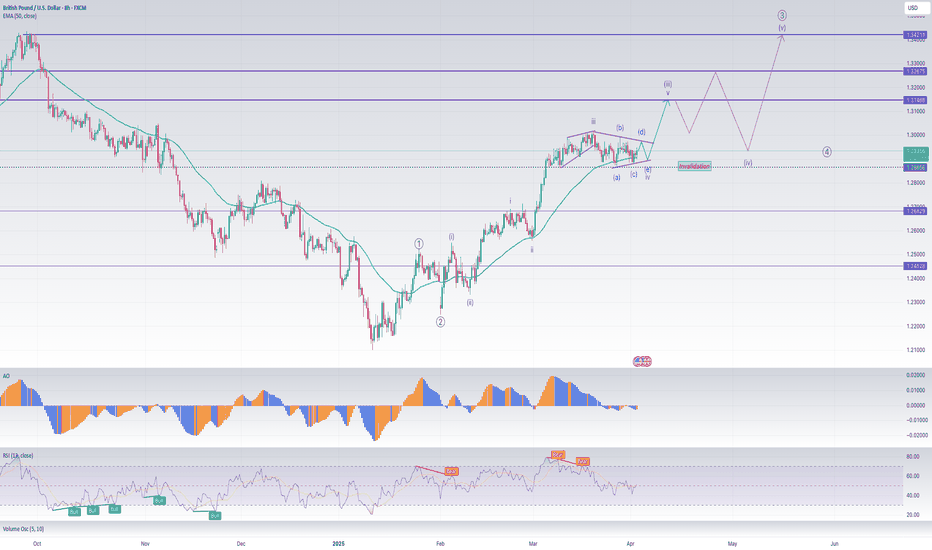
Hi Traders! GBP/USD: Possible Triangle Formation and Growth to 1.31500 On the 8-hour GBP/USD chart, a contracting triangle appears to be forming as wave 4. The pattern is not yet fully completed, but it is in its final stage. If the triangle is confirmed, we could see an upward movement in the pair. The primary target for growth is 1.31500, the 2023 high. A...
GBP/USD: Possible Reversal from 1.27500 📉 The GBP/USD pair is approaching the multi-year resistance level of 1.27500. On the 4-hour chart, we see a potential formation of the fifth impulse wave. This wave is not yet complete, but there is a high probability of its termination around this level. A significant correction may follow, providing an opportunity to...
USD/JPY: Yen May Weaken Ahead of Central Bank Meetings The yen continues to move within a downward trend, but a correction is possible ahead of next week’s central bank meetings. The upward move could reach the upper boundary of the channel at 149.50. #forex #trading #USDJPY #analysis #markets
Hi traders! Bulls tried to break through the upper boundary of the channel and the 192 resistance level… but no luck! ❌ Now, the bears are sharpening their claws and setting their sights on 184-182! 🎯
Hello Traders! EUR/USD: Possible Test of 1.05650–1.06 The EUR/USD pair is likely developing a five-wave impulse. The key invalidation level for the current wave structure is at 1.04200. As long as the price remains above this level, there is a possibility of further growth and a test of the 1.05650–1.06 zone in the coming days.
Hi All! Wave 4 Correction Before Further Growth Gold appears to have entered Wave 4 of a five-wave Elliott impulse from the 2955 level and is now in a corrective phase before resuming its uptrend. 🔹 Key Levels to Watch: 1️⃣ 2860 – A potential termination point for Wave 4, as multiple support levels converge here: • 0.23 Fibonacci retracement • Upper...
Hi Traders! The daily chart is flashing warning signs! 🚨 A double top has formed, and if the price consolidates below the 5850 support level, the main stock index could dive into a correction toward 5400. 📉🔥 #SP500 #StockMarket #Trading
Hello everyone! There is a high likelihood that gold may decline from its current level. The 2800 mark is a historical high and a critical level. Will the bulls be able to break through it immediately? From a long-term wave perspective, the price of gold may currently be in corrective wave 4, which is likely not yet complete, as the time targets have not been...
Hi All! Gold might take another shot at testing its all-time high—because why not? We could see the formation of a fifth-wave impulse with a broad target range of 2780–2792. However, if it breaks below 2750, gold may head down to test the 2720 support level. Let’s not forget—today is the Fed meeting, and Jerome is about to give the markets a reason to move....
Hello everyone! The USD/JPY pair failed to hold above the support level of 155.00, which suggests an increase in dollar selling within this pair. Our target is 151.50–152.00, with a possible further decline toward the key support level of 150.00.
🔥 Friends, the market is heating up! Bears have pushed oil down to a key support level – $72 per barrel. This is the last point where wave (5) of the impulse could start forming. 📉 Bearish scenario: A break below this level could send oil to new yearly lows. 🐂 Bullish scenario: We see a bullish divergence on the H1 chart, and the price is testing the upper...
Hi All! A day off is a good time for reflection. Oil Price Outlook: Potential Fifth Wave Impulse Up There is a high probability that oil prices, having broken through the upper boundary of the regression channel, may continue their upward movement with a target in the 81.20–84.00 range. This could be the fifth wave of an upward impulse. Wave Structure...


