EURGBP is currently trading near the support of the upward sloping trend line indicating support at lower levels; the pair has ended in a small bullish candlestick formation on 24th May supporting the above observation and indicating further upside potential for the currency pair. It is likely that EURGBP could rise towards 0.8670 and 0.8700 while it sustains...
Silver has been trading in a higher top higher bottom formation signifying uptrend; however it has witnessed some correction in the near term. It currently stands at the 23.8% retracement level of the rise experienced from 31st March to 18th May indicating a rebound in the offing. It would be prudent to say that silver could rebound towards $28.10 and $28.60 while...
USDJPY is currently trading at the 20-day SMA support suggesting limited downside potential, further it is also trading in a small bullish candlestick formation after bouncing from this support zone corroborating the above observation. RSI is rising indicating that a rebound in the pair could be witnessed in the coming sessions. It is likely that USDJPY could rise...
Crude oil is currently trading near the resistance zone which has kept a lid on crude oil prices since early March; RSI is also flat suggesting weakening of the recent uptrend. Crude could form a near term top around current levels from where a decline could be witnessed. It would be prudent to say that Crude oil could decline towards 65.50 and 64.50 while it...
EURGBP has been trading in a lower top lower bottom formation since December 2020; however it did experience a sharp rise since the first week of April signifying bottom formation below current levels. The pair is trading in a doji candlestick formation suggesting that the bearish trend is easing, indicating a rebound could be witnessed in the coming week. It is...
Crude oil has been trading in a medium term uptrend however it experienced some correction and currently stands at the upward slopping trend line suggesting support at lower levels. Positive slope of the 20-day SMA along with the RSI in buy mode supports the above observation and indicates further upside potential. It would be prudent to say that Crude oil could...
USDCHF currently stands at the upward sloping trend line suggesting support at lower levels, further it has ended in multiple doji formations near the trend line corroborating the above evidence. RSI is rising, supporting the above observation and indicating further upside potential. It is likely that USDCHF could rise towards 0.9170 and 0.9205 while it sustains...
EURJPY has been trading in a higher top higher bottom formation suggesting the trend to be bullish in the near term, in the near term the pair stands at the 23.6% retracement of the rise experienced since 24th March to 29th April suggesting rebound in the offing. Positive slope of the 20-day SMA supports the above observation and a rise could be seen in the near...
Gold has retreated after testing its resistance near $1,795-$1,800 range, suggesting limited upside potential, further it has been trading in a lower top lower bottom formation suggesting weakness in the medium term and further downside potential. It would be prudent to say that Gold could decline towards $1,765 and $1,750 while it sustains below $1,805. Risk...
EURGBP is currently trading near the horizontal resistance zone suggesting overhead resistance and limited upside potential, this is the third time since late February that the pair is facing resistance near these 0.8720 level. EURGBP has been trading in a lower top lower bottom formation suggesting the trend to be bearish and indicating further downside...
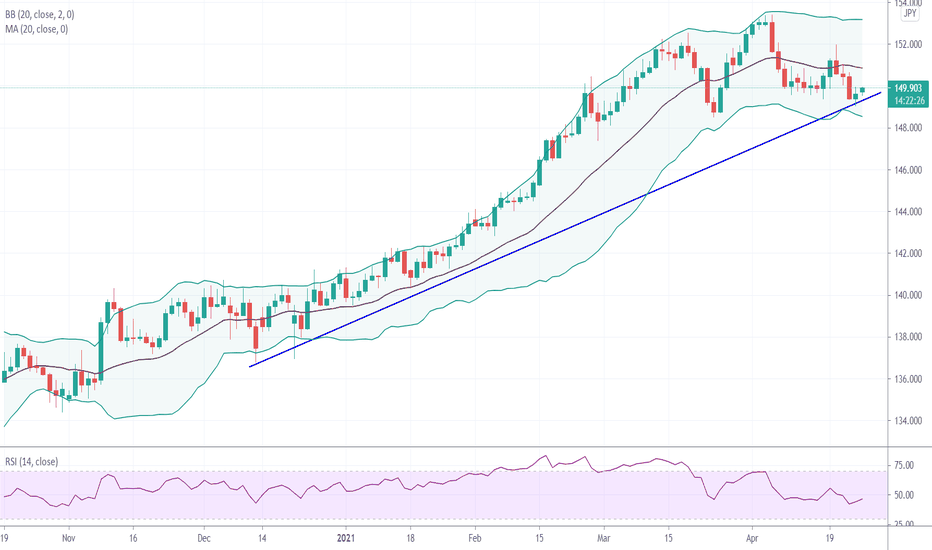
GBPJPY currently sits at the support of the upward sloping trend line suggesting limited downside potential, it ended in a small doji candlestick formation on Friday supporting the above observation. RSI has risen slightly supporting the above observation and indicating further upside potential. It is likely that GBPJPY could rise towards 150.25 and 150.90 while...
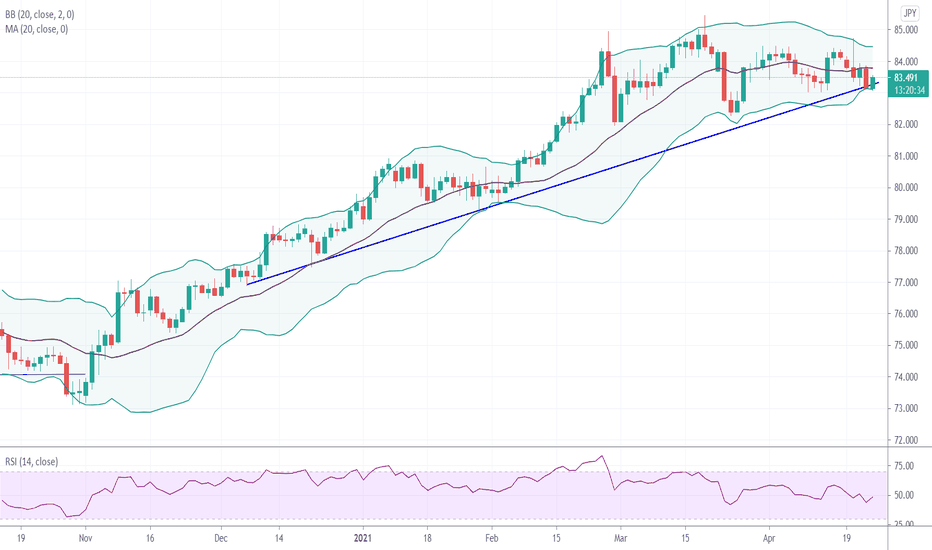
AUDJPY has been trading in a higher top higher bottom formation suggesting the trend to be bullish in the medium term; recently the pair has experienced some correction and stands at the support of the upward sloping trend line suggesting rebound in the offing. RSI has turned up corroborating the above observation and indicating further upside potential. It is...
USDJPY currently stands at the 50% Fibonacci support of the rise experienced from 23rd February to 31st March, suggesting a rebound in the offing. The pair has made two consecutive doji candlestick formations on 20th and 21st April indicating support at lower levels and a possible rise while this support holds. It is likely that USDJPY could rise towards $108.50...
Dollar index has risen sharply since February end but has experienced correction from 31st March; it currently stands at the 50% Fibonacci retracement of the rally from 25th February to 31st March, suggesting support at lower levels. It has ended in a doji candlestick formation on 15th March near this Fibonacci support and the lower Bollinger band, suggesting a...
USDCHF currently stands at the 38.2% retracement of the rise experienced from January to April 2021, indicating support below current levels. On 14th April the pair ended in a small bullish candlestick formation suggesting buying below current levels, RSI is rising indicating further upside potential. It would be prudent to say that USDCHF could advance towards...
GBPJPY has been trading in a higher top higher bottom formation since last few months suggesting the trend to be bullish. The pair has experienced some correction since 6th April, but currently stands at the upward sloping trend line indicating a rebound in the offing. It would be prudent to say that GBPJPY could advance towards 151.50 and 152.50 while it sustains...
USDJPY has been trading in a strong uptrend as the dollar continued to strengthen since January 2021; currently it has experienced some correction but is trading above the 20-day SMA. The pair stands at the 23.6% Fibonacci support of the rise experienced from 23rd February to 31st March, indicating support below current levels. It would be prudent to say that...
USDCHF is trading above the 20-day SMA and has been trading in a higher top higher bottom formation since the last few months indicating the trend to be bullish in the near term, further it currently is at the upward sloping trend line advocating for a rise. The current dip looks to be a correction which is likely to find buyers near 0.9380-0.9340 zone indicating...


