AbedEkhlaspoor
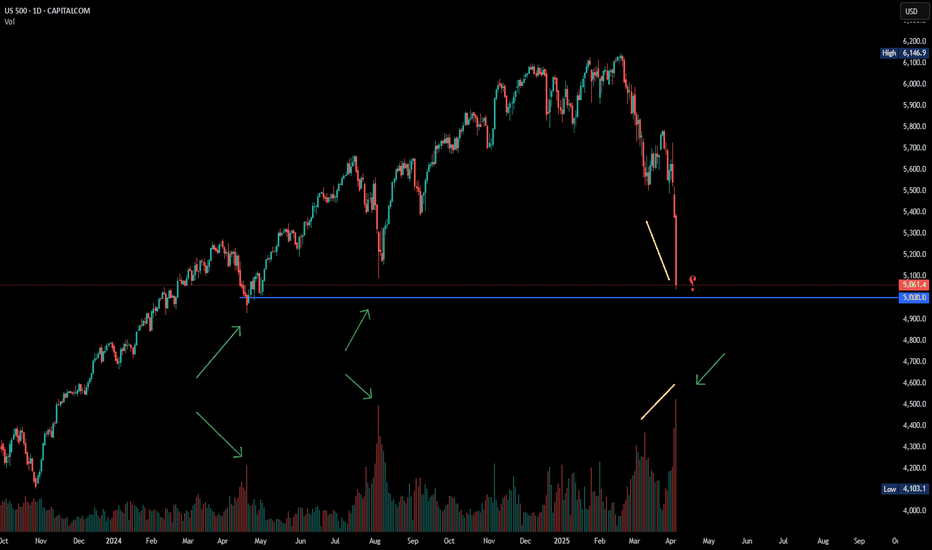
Based on the market volume chart, as well as its similarity to previous declines, it seems like we are approaching a reliable bottom. This bottom is not far away and could happen right around 5000. We just have to wait for the daily reversal candle.
All the strong supports have been broken and the stock market is bleeding! You can see one of the important supports ahead on the chart! 3 zones are stacked on top of each other! We are waiting for a reaction to this area.
As can be seen in the chart, the Euro is fluctuating within the trading range on the 15-minute timeframe. We wait for a breakout with a strong candle from either side and enter the trade in the direction of the breakout with a target equal to the width of the trading range and a stop loss behind the breakout candle.
Considering the zone marked on the chart and considering that the price has seen a lower low, it seems that the upward correction in the price will end soon and we should wait for a new downward movement. Targets and stop loss of my position are marked on the chart.
As you can see, due to recent economic news and Trump's economic approaches, we have unfortunately witnessed a decline in major indices, including the Dow Jones. We are currently at the last available support level, which is the bottom of the Dow Jones long-term channel, and we need to see how it reacts to this level in tomorrow's news and the CPI release.
Given the recent emotional decline in the Dow Jones and S&P500 due to Trump's tariff policy, the S&P500 is expected to make an upward correction from the bottom of its confirmed ascending channel. The stop loss is equivalent to the closing of the 4-hour candle below today's last low, with a target of 5900 in the final step.
Given the recent emotional decline in the Dow Jones and S&P500, the Dow Jones is expected to make an upward correction from the bottom of its confirmed trading range. The stop loss is equivalent to the closing of the 4-hour candle below today's last low, with a target of 43,500 in the final step.
As you can see in the gold chart, the price has reached the top of the ascending channel and at this point in the past of the market there is also a very important static resistance (around $2750) which can correct the price of gold in the short term.
If we look closely at the gold chart, we have broken a good pattern up and we have an untouched point as a target. We expect to move towards the specified target after a short correction. Of course, next week the correction may be much smaller than expected! Selling deals are a bit more risky at the moment
The euro is at the bottom of the daily time frame trading range and has collected liquidity well below it. There is a possibility of price growth towards the middle of this trading range
This is the ascending channel of gold. According to this channel, we can make a decision. Sell positions are not reasonable at all right now. But if we see a red candle from the top of the channel, we can open a sell position to the bottom of the channel with a reliable stop loss.
It seems that the break of the long-term trend line of the euro was done the other day after the election of Trump as the president of the United States. In this range up to 1.06, we can expect to continue the fall. A position with R:R equal to slightly more than 1. It is not very attractive to enter, but you can think about it!
On the daily time frame, EURUSD reached the bottom of its ascending channel and we saw a temporary positive reaction from it. This reaction point, in addition to being the bottom of the ascending channel, was also an important order block in my daily time frame, which caused the price reaction. The medium-term target is the middle line of the channel.
According to the weekly chart of the dollar index and since tomorrow and next week we have important data such as unemployment claims, and also these data will probably strengthen the strength of the dollar, it is expected that the dollar index will rise to the middle of the trading range in the first step. .
According to the economic data that was published recently and in the last two weeks, it seems that the euro will continue its downward movement. The two yellow and red paths are the possible paths of the euro towards the goals written in the chart. Capital management should always be your top priority.
Considering the political developments in the world as well as the upcoming American elections, and on the other hand, according to the economic data published in the last few weeks, it seems that the Dow Jones index will start to move downwards from this price point! The long-term target is specified in the chart
Considering what happened to Donald Trump, it is not unlikely that gold will reach the $2500 level soon. We will wait until the excitement of the market is discharged at the reopening and after that we will decide to enter into the transaction. We are not in a hurry.
In high and long-term time frames, a very large divergence can be seen in the Bitcoin chart, which probably signals a deeper price correction. Be careful for buy deals!


