## **DXY (Dollar Index) Technical Analysis – 2W Chart** ### **1. Uptrend Since 2008** The Dollar Index (DXY) has been in a **long-term uptrend** since the 2008 bottom (around 70.70). The chart shows a clear pattern of **higher highs and higher lows**, establishing a bullish market structure over the past 15+ years. --- ### **2. Ascending Channel** The price has...
WCUUSD is another indicator of the direction in which the dollar index is headed. The weakened dollar broke below the support line, which opens the door for a further pullback to the 0.74000 level (orange support line). The reason why we might expect strong support for WCUUSD here is because it matches the previous pullback from 7.00%-7.50%.
In the first Fibonacci setup, we observe a retracement of the index to the 61.8% Fibonacci level, after which a trendline could be drawn. Applying a second Fibonacci retracement on the chart reveals that the Dollar Index once again found support within the 50.0%-61.8% zone. In January of this year, the dollar attempted to break above the 110.00 level but...
AUDUSD has been slowly stabilizing. The bearish trend has definitely slowed down. We can say that we see the formation of a triple bottom, from which we could see a move to the bullish side. A break above 0.61000 should be enough of a tailwind for further recovery.
USDCHF continues its bearish trend since mid-January and all indications are that we will see a return back down to the zone around 0.84000. The pair failed to break above the EMA 200 weekly moving average, which further increased the pressure on the dollar.
The dollar index could continue the current bullish consolidation and recover to the 105.00 level. There we encounter resistance in the trend line and the EMA 200 moving average.
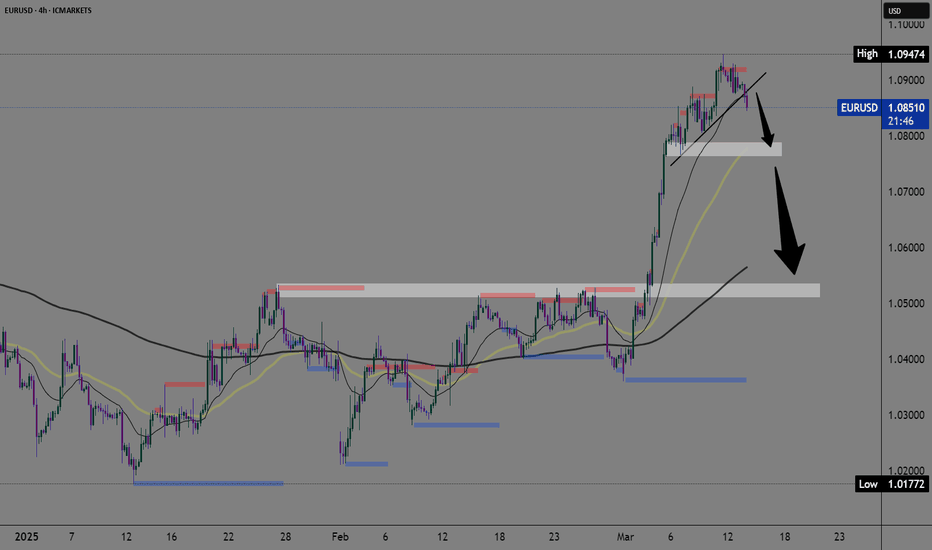
EURUSD loses bullish momentum. We see a deceleration of the bullish impulse and a transition to consolidation that led to a breakout of the trend line below 1.08500. The next important level is 1.08000 because below that we can expect a stronger pullback, maybe even a return to 1.05000.
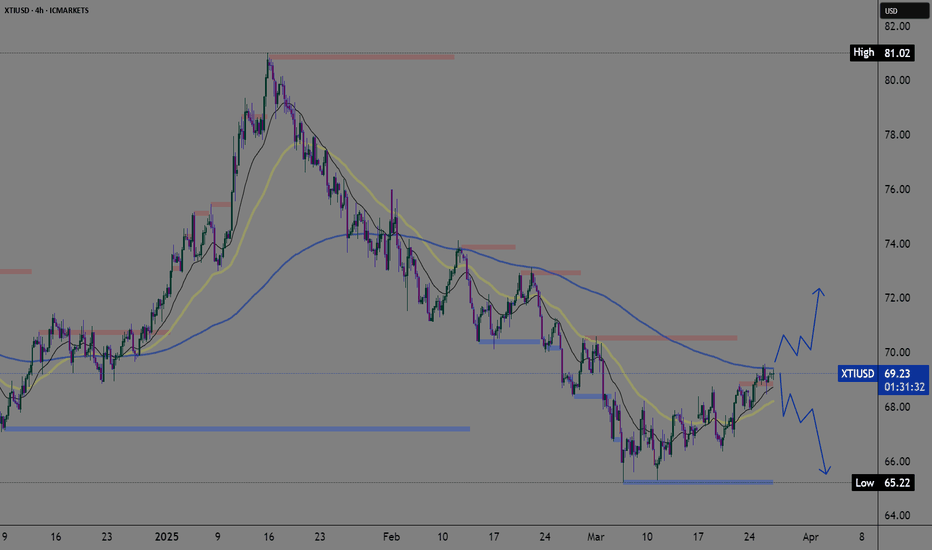
The oil price is testing the EMA 200 moving average zone. $70.00 could be a big hurdle, from where we would start a new pullback. Conversely, rising tensions in the Middle East are supporting oil prices. Based on that we can hope for a bounce above $72.00.
GBPUSD has been testing the support zone for ten days now, and we could easily see a drop below to a new two-week low. The main target is the EMA200 moving average in the 1.28000 zone.
EURUSD is in retreat after resistance in the 1.09500 zone. We are currently seeing a test of 1.08000 with pressure to continue on the bearish side. Around 1.07000, the pair will have a chance to look for support in the EMA200 moving average. If that is not enough, we continue down to the 1.05000-1.06000 support zone.
$76,600 is a new five-month low for Bitcoin formed this morning. After failing to stabilize above $90,000, the price started a new pullback. An additional failure is that no new high was formed, and a new lower low was formed compared to February 28. Bitcoin is currently recovering and we could see a return to the $86000-$88000 zone.
EURAUD could soon make a pullback after a two-week bullish rally. The pair rose by 1000 pips in that period, a similar jump to last year.
USDJPY is on track to pull back to the 140.00 support zone. Last year, we received support twice in that zone and successfully returned to the bullish side. At the beginning of this year, the pair failed to break above the 160.00 level and retest the previous low. This triggered a bearish consolidation that is still current.
Where will the price of gold in the week US CPI? A strong CPI could halt the rise in gold prices, hinting that the Fed may delay a rate cut scheduled for next week. A weaker CPI indicates that we are continuing towards the target of 2.00% and this would mean that the Fed continues to cut interest rates and dovish policy. A break below $2900 would push the price to...
EURCAD is close to the multi-year resistance zone from where we could have a good opportunity for a pullback and a return to the bearish side.
EURUSD enters an interesting zone and is close to a retest of the previous double top from last year. The pair has good momentum to revisit the 1.10000 level.
Oil is on a big test in the $68.50 zone. With a break above, the chances for a retest of the $70.00 level increase. A little higher in the $71.00 zone, the EMA 200 moving average is approaching, which was an obstacle to further oil price recovery on the previous two occasions.
The JPY index has the opportunity to push the Japanese yen and thereby strengthen the currency against others in the next month.


