Here’s a my structured analysis and actionable plan for the gold trade based on the levels provided: --- ### *Trade Setup Summary* - *Current Position: 3035 (assumed entry for a **long position*) - *Targets*: 1. *First Target (T1)*: 3052 (+17 points from entry) 2. *Second Target (T2)*: 3062 (+27 points from entry) - *Stop Loss (SL)*: 3015 (-20 points...
My suggesting a sell position on the BTC/ETH pair at 42.6300, with target levels at 39.0750, 37.2400, and 35.3560, and a stop-loss at 44.5800. Analysis & Considerations 1. Risk-Reward Ratio If your first target is 39.0750, your risk (stop-loss) is 1.95 ETH, and your reward is 3.55 ETH → Risk/Reward = 1:1.8, which is decent. If aiming for 35.3560, the R/R...
MY XAGUSD (Silver) sell trade setup looks like this: Entry: 33.1840 Stop Loss: 33.7000 Target 1: 31.9075 Target 2: 31.0000 Trade Analysis: Trend Line Breakout: Indicates potential bearish momentum. Risk-Reward Ratio: Target 1 (31.9075): ~1.27 RR Target 2 (31.0000): ~3.68 RR (solid swing trade target) Key Levels: If price breaks below 32.50, it could...
It looks like gold has broken its ascending channel, signaling a potential correction or consolidation. Based on My technical analysis targets, the key support levels to watch are: $3,000 – Psychological level, could act as support/resistance. $2,982 – Minor support within the current price action. $2,955 – Potential bounce zone if selling pressure...
The USD/JPY trade setup you've described appears to focus on a bullish trend line breakout, but there are inconsistencies in the terminology and risk-reward structure that need clarification. Here's a refined interpretation and analysis: --- ### *Trade Setup Rationale* 1. *Entry Point 149.500 *: Likely triggered by a bullish breakout above a descending trend...
It looks like My analyzing a potential short trade setup for gold. Here’s a quick breakdown: Entry: Sell at 3043 Stop Loss: 3050 (70-point risk) Targets: 3033 (first target, +100 points) 3022 (second target, +210 points) 3006 (final target, +370 points) Key Considerations: Breakout Confirmation: If gold is near the trendline, watch for a strong break...
MY ETH/USD trade idea suggests a strong bullish setup, targeting significant upside levels. Here’s a refined breakdown: 📈 Trade Setup Entry: Buy now at 1960 (current level). Targets: 🎯 Target 1: 2230 (first key resistance). 🎯 Target 2: 2525 (next major level). 🎯 Target 3: 2830 (longer-term bullish objective). Stop-Loss: 1765 (below recent support to manage...
My XBR/USD (Brent Crude) trade idea is solid, with a strong bearish confluence based on technical indicators. Let's refine it a bit: Trade Breakdown: Bearish Bias: Price rejected the upper trendline of an ascending channel. Indicators Confirming: CCI & %R exiting overbought → Bearish momentum starting. Imbalance below → Potential price correction...
My EUR/USD trade idea is well-structured based on the recent breakout and descending channel formation. Here’s a refined breakdown of the setup: Trade Plan: Entry: Sell only after price consolidates below 1.0834 (to avoid false breakouts). Target (TP): 1.06143 (next major support level). Stop-Loss: Consider placing it around 1.0865 - 1.0880 (above recent...
Here's an analysis of My Bitcoin trade setup: ### 1. *Risk-Reward Ratio* - *Risk: 85,400 - 82,400 = **3,600 points* (3.29% downside). - *Reward*: - Target 1: 91,500 - 86,000 = *5,500 points* (6.3% gain). - Target 2: 95,000 - 86,000 = *9,000 points* (10.42% gain). - *Risk-Reward Ratios*: - Target 1: *1.53:1* (5,500 / 3,600). - Target 2: *2.5:1*...
*USDCHF Trade Analysis & Evaluation* *1. Trade Setup Overview:* - *Entry Condition:* Buy signal triggered if USDCHF consolidates above *0.8815* and the 50-period Moving Average (MA50), suggesting a bullish breakout. - *Targets:* - *Target 1:* Likely typo; assumed corrected to *0.8860* (45 pips above entry). - *Target 2:* *0.9145* (330 pips above entry). ...
My GBP/JPY sell zone suggests a bearish outlook with downside targets at 192.480, 191.500, and 190.720, while maintaining a stop loss at 194.600. Key Levels & Analysis: Resistance (Stop Loss): 194.600 – If price breaks above this, the bearish setup is invalidated. Support Levels (Targets): 192.480: First support, minor retracement level. 191.500: Stronger...
My EUR/USD technical analysis suggests a bearish outlook with downside targets at 1.08400, 1.07888, and 1.07500, while maintaining a stop loss at 1.09500. Key Levels & Analysis: Resistance: 1.09500 (stop loss level) Support Levels: 1.08400: Minor support, potential retracement zone 1.07888: Stronger support, aligns with previous price action 1.07500: Major...
MY gold trade setup using the bullish flag pattern suggests: Entry: 3025 Target: 3028 Stop Loss: 3016 Risk-Reward Ratio Analysis Risk: 3025 - 3016 = 90 points Reward: 3048 - 3025 = 300points Risk-Reward Ratio (RRR): 1:0.33 Considerations: The risk-reward ratio is quite low (typically, traders aim for at least 1:2 or 1:3). Bullish flags usually indicate...
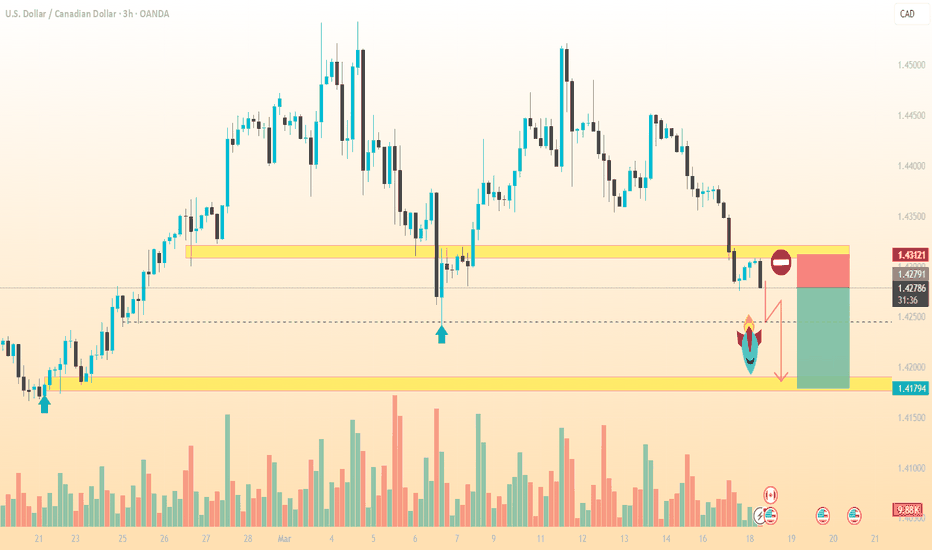
Here’s a structured analysis of the *USDCAD sell trade setup, assuming the entry is near current market levels (e.g., **1.4300–1.4310*). If the entry differs, adjust calculations accordingly: --- ### *Trade Summary* - *Entry: *Not specified (Assumed near *1.4300*) - *Stop Loss (SL): **1.43130* (13 pips risk if entry is 1.4300) - *Targets*: 1. *1.42400*...
Here's a structured analysis of the USD/JPY buy trade setup: ### *Trade Summary* - *Entry*: 149.70 - *Stop Loss (SL)*: 148.00 (170 pips risk) - *Targets*: 1. *151.00* (+130 pips) 2. *152.00* (+230 pips total) 3. *155.00* (+530 pips total) --- ### *Key Analysis* 1. *Risk-Reward Ratios*: - *1st Target*: 0.76:1 (Risk > Reward). - *2nd...
*Gold Trade Plan Analysis & Recommendations* *Entry Point:* 2912 *Stop Loss (SL):* 2894 (180 points risk) *Targets (TP):* 1. TP1: 2920 (+80 points) 2. TP2: 2930 (+180 points) 3. TP3: 2952 (+400 points) --- ### *Key Considerations & Adjustments* 1. *Risk-Reward Ratios:* - *TP1:* 8:18 = *1:2.25* (Low reward for risk). - *Overall Potential...
*Bitcoin (BTCUSD) Trading Signal Analysis & Strategy* *1. Technical Overview:* - *30-Minute Chart:* A potential bullish reversal pattern (e.g., inverse head and shoulders or double bottom) is forming, with price testing the *100-period Moving Average (MA)* resistance. A confirmed break above this MA could signal upward momentum. - *Daily Chart:* *Bullish...


