Ali-Mani
PremiumThere’s been a flood of noise in the media over the past few weeks—headlines shouting about uncertainty, new U.S. tariffs, market crashes, and an impending recession. Years ago, I used to pay close attention to this kind of news, identifying myself as a "fundamental analyst". It didn't take long until I realised that I was looking in the wrong direction. What...
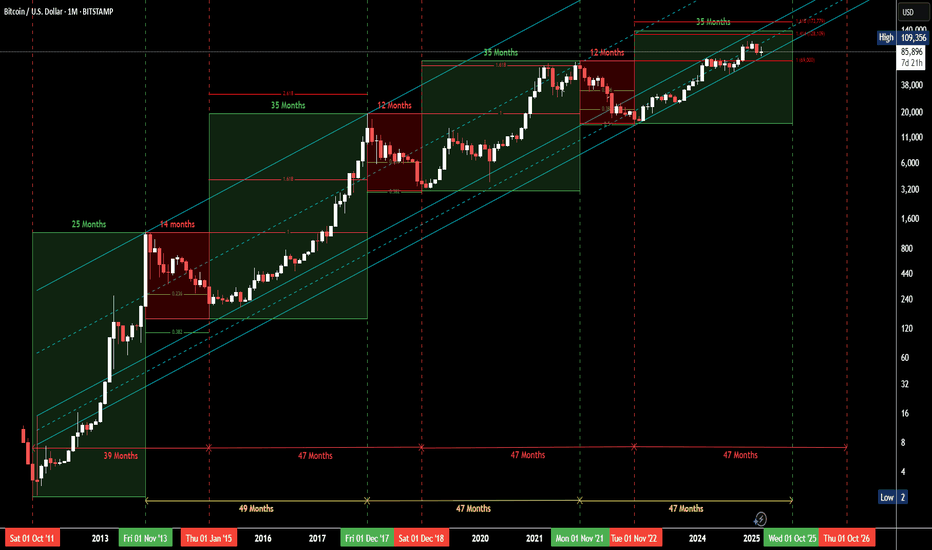
Following my recent publication, the market’s micro movements continue to closely mirror the structure of the previous bull cycle, as illustrated by the blue bars in the model. If history is to rhyme once again in this stochastic-driven market, we can expect a few more short-term declines in the coming weeks, potentially retesting the 50-week EMA to establish a...
One of the most important, yet underrated, factors in trading is psychological resilience. While numbers, charts, and data analysis play a key role, what truly separates consistent traders from the rest is their ability to navigate the uncertainty that dominates real markets. 🎲 Deterministic vs. Stochastic Thinking in Trading We’re all trained from an early age...
Hi Everyone, Welcome to this analysis about Bitcoin. By looking at my previous publication, you see that I consider 50 Week Moving Average as a very strong and firm support line, which I like to not to be broken, because by looking at the historical data, we can conclude that when 50 Week Moving Average (Yellow Line) is broken, BTC makes its way all the way down...
Hi Everyone, Welcome to this analysis about Bitcoin. In the last publication, I raised my concern about losing 50 Week Moving Average, indicating that this will cause significant consequences for Bitcoin. Since then, Bitcoin has dropped more than 30%, and I believe that the ultimate bottom is yet to be found. However, it can’t just go down sharply from 47K to...
If history is any indication: * After having a Bull-Run (recording a new ATH ), when BTC loses the 50WMA (Orange Line), it drops and finds support at the 200WMA (Red Line). * In the current cycle, the projected 200WMA (Red Dashed Line) has the confluence with the bottom of the Super-Macro channel, and the top of the last cycle. So, the 50WMA Level (Orange Line)...
As we know the Wyckoff's method is a judgmental method, meaning it can't be applied solely by drawing the patterns. What make it even more difficult, is the fact that we have found the bottom for a while, but we are still not sure if this is Accumulation or Re-distribution Phase! According to what we have experienced over the last several months, Wyckoff's...
Currently, looking at BTC in the 4H Time Frame. Bitcoin has touched the bottom of both the symmetrical triangle and the local downward channel at the same time. I believe that Bitcoin is more likely to move up and touch the top of this symmetrical triangle when it breaks its local channel. Target 1: $43,000 Target 2: $49,000 If Bitcoin fails to move up, the...


