Ali_Explorer
PremiumTrade Setup: USDJPY – Short Position Opportunity A technical sell signal has emerged on the USDJPY pair, offering a short-term bearish trading opportunity based on current price action, resistance levels, and weakening bullish momentum. USDJPY is trading near a key resistance zone around 148.200, where price has previously faced rejection, suggesting sellers are...
OANDA:XAUUSD 📉 Trade Opportunity: XAUUSD (Gold) – Short Position Setup A sell opportunity has emerged on XAUUSD, presenting a high-probability trade idea supported by technical indicators, resistance rejection, and potential for short-term downside movement. 1. XAUUSD is currently trading near a...
Trade Setup: Bitcoin (BTC/USDT) – Long Position Opportunity A potential buy setup on Bitcoin (BTC) has emerged, supported by favorable short-term technical patterns and price action signals pointing toward upward momentum. BTC is currently hovering near a minor support zone just above 118,750, which has previously held as a base...
Trade Setup: AUDUSD – Short Opportunity Identified A fresh sell opportunity on AUDUSD has been spotted, backed by bearish market structure, technical resistance, and macroeconomic sentiment favoring a downside move. AUDUSD is currently trading near a key resistance zone around 0.65250, where the price has previously failed to break...
Trade Opportunity: EURUSD – Short Position Setup We have identified a potential selling opportunity on the EURUSD pair, supported by current price structure, momentum shifts, and broader market dynamics. EURUSD is currently facing strong resistance near the 1.15850–1.15900 zone, which has rejected price multiple times in...
OANDA:EURGBP rade Setup: EURGBP – Buy Opportunity Identified We have spotted a favorable buying opportunity on the EURGBP currency pair, supported by technical patterns and recent market behavior. EURGBP is showing signs of a bullish reversal after bouncing off a short-term support zone near the 0.86680–0.86700 range. The entry at...
The entry point of 1.83350 is strategically placed to catch the breakout above minor resistance. The first target at 1.83480 captures a short-term price retracement zone with high probability. The second target, 1.83610, aligns with the upper boundary of a recent consolidation range. The third target, 1.83700, is placed just below a psychological resistance...
XAU/USD Trade Analysis – buy Setup 📍 Trade Idea: buy Gold (XAU/USD) Entry Zone: 3338/3336 Stop Loss: 3326..00/Above key resistance zone) Take Profit Levels: 🎯 TP1: 3345 🎯 TP2: 3350 🎯 TP3: 3360 Targets are set conservatively and progressively at 3345, 3350, and 3360, capturing potential resistance zones and allowing partial exits to secure profits while...
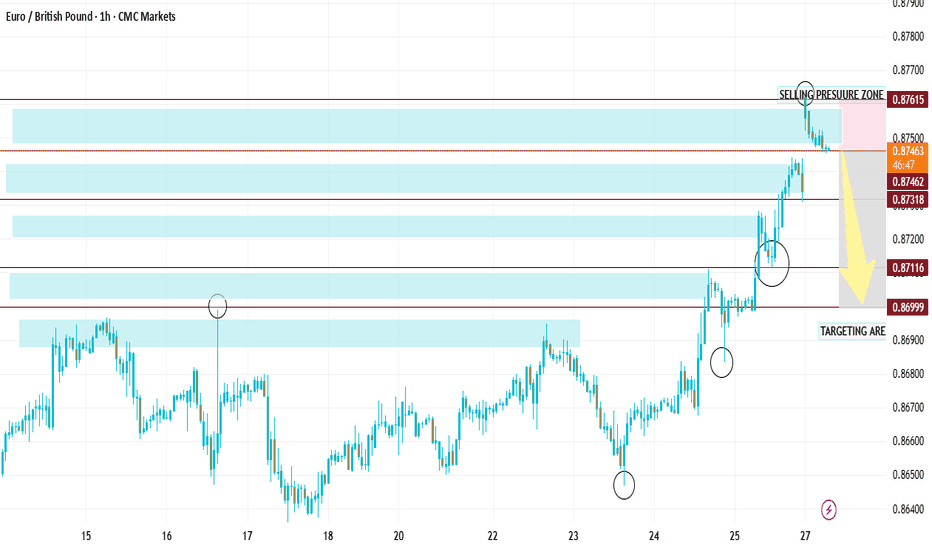
OANDA:EURGBP 💼 Trade Idea: EUR/GBP – Short Position A potential selling opportunity has emerged on the EUR/GBP currency pair, suggesting that the Euro may continue to weaken against the British Pound. Based on current technical patterns and market sentiment, a short position could be favorable at the identified levels. 📉 Entry Zone: 0.87467 🎯 1st Target:...
$EURUSDTrade Idea: EUR/USD – Short Position Opportunity We are currently observing a EUR/USD selling opportunity. 📌 Entry Zone: 1.17539 This level presents a favorable point to initiate a short (sell) position, based on current market structure and momentum indicators. 🎯 Target 1: 1.17300 🎯 Target 2: 1.17200 🎯 Target 3: 1.17150 These targets are based on key...
💹 GBP/USD Trade Analysis – Sell Setup 📍 Trade Idea: Initiating a short (sell) position on GBP/USD at the current market level. --- 🔽 Entry Zone Suggested Entry: 1.34393 This level aligns with a minor resistance area formed by recent price rejection. It offers an optimal spot for initiating short positions, especially after confirmation of bearish pressure...
📌 Trade Idea: Sell USDJPY (U.S. Dollar / Japanese Yen) Current Market Action: Based on recent technical analysis and price behavior, a selling opportunity in USDJPY has been identified. Entry Zone: 147.90 – This is the ideal level where traders can initiate a sell position. It aligns with recent price rejection levels and shows early signs of bearish...
🔔 Trade Entry Recommendation: Entry Zone: 198.70 This zone presents an ideal entry point for sell, as it lies just above a critical support area, 🛡 Stop Loss: SL: 199.50 Placing the stop just below the support zone offers a favorable risk-reward ratio, while still allowing for normal price fluctuations. 🎯 Take Profit Targets: TP1: 198.00 The first target...
AUD/CAD Trade Signal – Strategic Short Opportunity Identified A compelling short-selling opportunity has materialized on the AUD/CAD currency pair, presenting traders with a potential low-risk, high-reward setup. The pair is currently trading near a key resistance level, showing signs of bearish exhaustion and potential reversal. Market participants are...
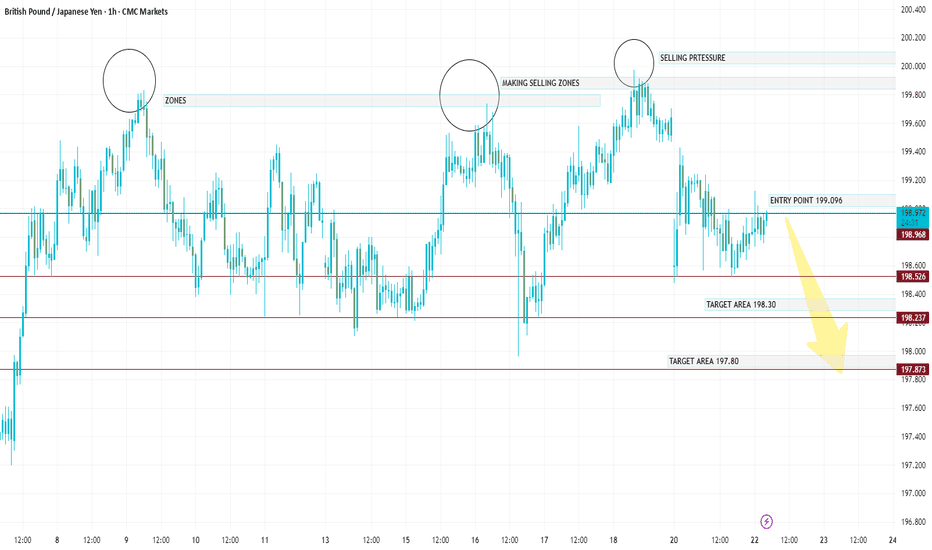
GBP/JPY Trade Analysis – Short Position Entry: 198.953 (current market price) Direction: Sell (Short) Stop Loss (SL): 199.700 Take Profit (TP) Levels: TP1: 198.30 TP2: 197.80 TP3: 197.00 Technical Outlook:
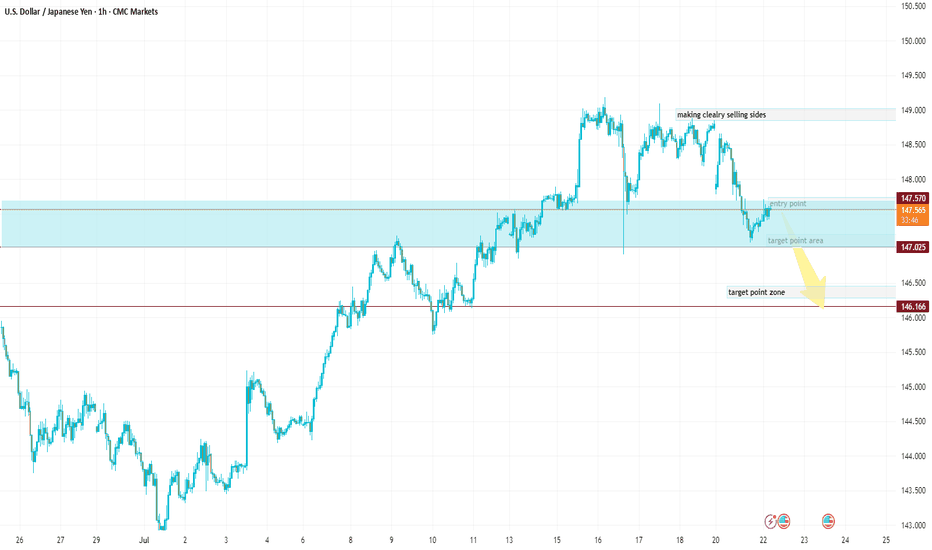
Entry Point (for Sell): Around 147.800 – 147.600 🔻 First Target (TP1): 147.050 – Labeled as "target point area" 🔻 Second Target (TP2): 146.300 – Labeled as "target point zone" 🛑 Invalid Zone (Sell Weakens): Above 148.600 – 149.000 (marked as “making clearly selling sides”) Entry Zone: Current market is near your ideal entry zone. A pullback or rejection around...
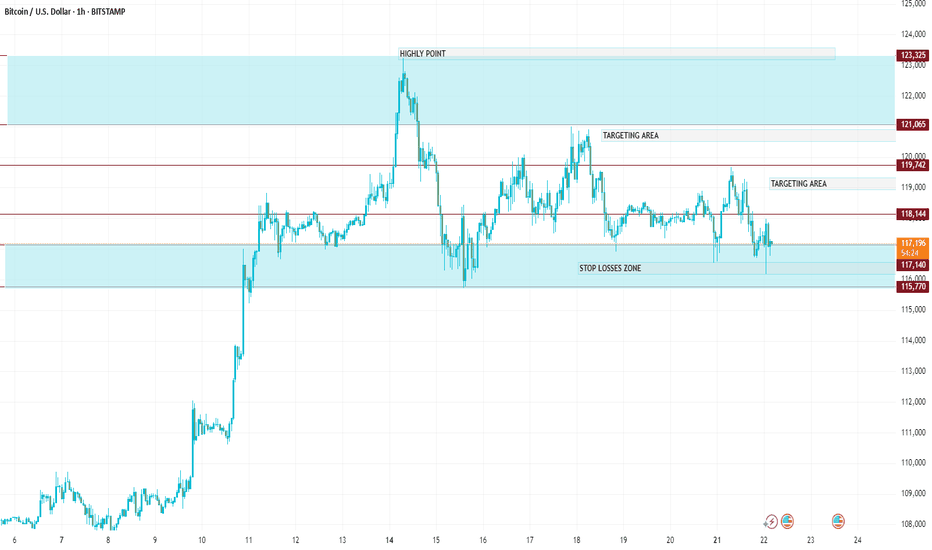
Target Levels (Upside Potential) 📍 Entry Zone: Enter near stop losses zone (approx. 117,000 – 117,200 range). Ideal after bullish confirmation (hammer, engulfing, or breakout from small range). 🎯 Take Profit Targets: TP1: 117,800 – 117,900 → First "TARGETING AREA" TP2: 118,300 – 118,500 → Second "TARGETING AREA" TP3: 119,000+ → Final move towards the "HIGHLY...
Buy Setup 🔹Entry Zone: Between 3,390.000 – 3,380.000 (around the bottom blue line area where the bullish impulse started). This zone has already shown some buying pressure, and price is retesting it now. 🔻Stop-Loss (SL): Just below 3,380.000, ideal level: 3,375 This is below the last major swing low to reduce false breakouts. 🎯Take-Profit (TP): TP1: 3,410.000...


