Alireza_kamali
"Ethereum Classic is currently in a range box on the weekly timeframe and is now at the bottom of the channel. It has the potential to move up to the top of the box. After confirmation, you can consider entering a long position."
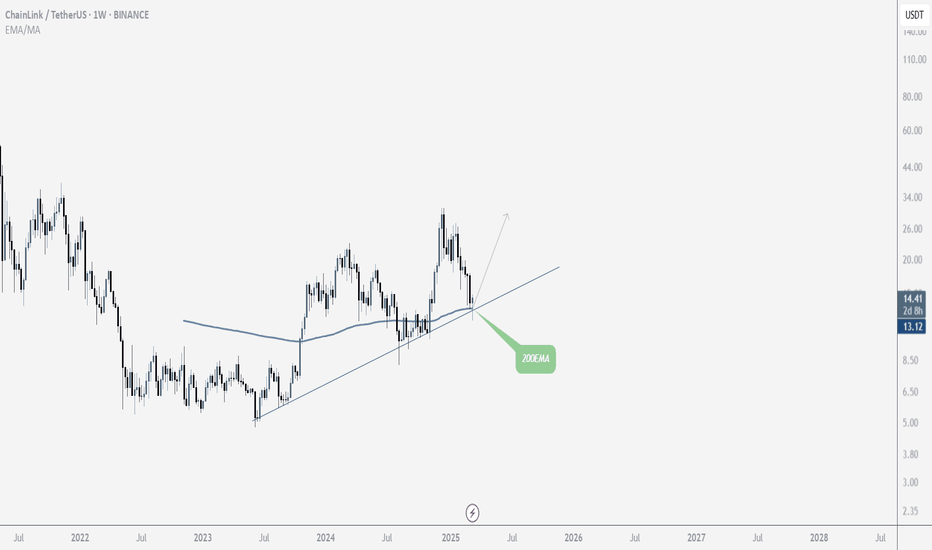
LINK is in a strong ascending channel on the weekly timeframe, aligning with the 200 EMA. If it confirms support, it could be a good buying opportunity. Keep it on your watchlist!
DOT has reached a strong support level. We can even consider it as a potential triple bottom. The weekly candle closes in two days—if it closes well, we can consider a position. I'll wait for the weekly candle to close.
Bitcoin has formed a double top and is pulling back. The marked zone has broken out strongly, increasing the chances of an upward move. However, I expect it to range heavily rather than move sharply. I’ve analyzed different scenarios.
Ethereum is at a strong level on the weekly timeframe, but the $4,000 resistance remains a key hurdle, acting as both a psychological and static resistance. However, if it breaks through, Ethereum could see a solid rally in the mid-term, potentially gaining around 40-50%.
Litecoin has broken its downward trendline, but the key static resistance ahead remains crucial. If it manages to break through, it could see a strong rally. It's better to wait for confirmation. Keeping it on the watchlist seems like a good idea!
Nothing to say everything is clear ... waitng for target ( about 60-80% gain )
Cardano has been showing a strong uptrend on the weekly timeframe, with higher highs and higher lows confirming its bullish momentum. The overlap of the static level and the 61% Fibonacci retracement forms strong support, and a solid candlestick is taking shape. Targets are based on Fibonacci levels, making it a promising setup for the long term .
Dogecoin, considering the strong hype around meme coins, Elon Musk’s support, and its strong uptrend on the weekly timeframe, could be a good buy opportunity. It's currently sitting on the 55 EMA and also at the 61% Fibonacci level, providing strong support. I’ll wait for its reaction to see how the weekly candlestick closes.
Rose is sitting on its weekly support, and if confirmation is received, you can enter. Don't forget the stop loss!
In the weekly timeframe, it seems that the price has broken its upward trendline. But I'll wait for the pullback. On the other hand, the price might also reach the upper drawn trendline, which could be a good point for a sell.
I think it's enough for the price drop! It hasn't had any growth and is sitting at the bottom price. Look for a good buying opportunity in a lower timeframe, like 1-day or 4-hour.
Bitcoin has formed a double top on the daily timeframe and failed to break above its resistance level. On the other hand, it couldn't hold its minor support either and has broken the level. I'm waiting for a pullback. However, the price might show some reactions around the 92 level. If that level is lost, I have identified the next support level based on the...
NYSE:ENS on 61fibo and static support but we're in 1W timeframe we should to wait to close candle target based on fibo also
CRYPTOCAP:SOL on dayli support and 200ema (yeah I use 200ema a lot :) ) it can growup
TSX:SXP in uptrend ch and also at 200EMA it could be near mid of ch or upper Any way , pay attention at
Just pay attention at FLM it could breakout resistance Price at 200EMA and 61fibo it's a good point but also look at the CRYPTOCAP:BTC becuase it's leader of market
Seem like btc want's to do pattern again by the way pay attention to the resistance


