AlpenglowTrader
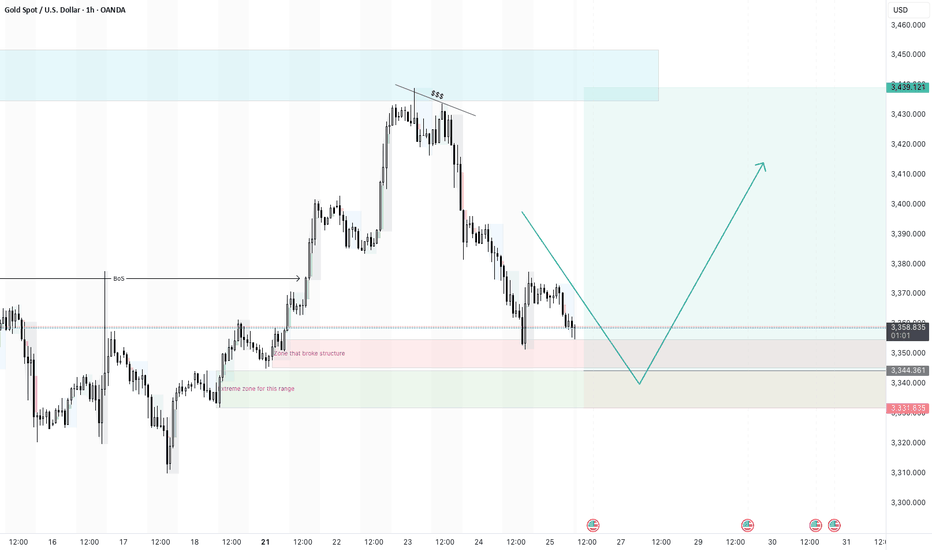
PlusThe setup is not great, but im expecting a pull back on the dollar which should result in a bullish move on the GBP and EUR. There is an extreme zone that i would like price to reach to with the possibility of not taking out the previous HL. But lets see. +ve: 1. Extreme zone that resulted in the bullish move. 2. slight imbalance above the extreme zone 3....
Price has reached a zone that broke the structure - see BoS on the left. Now that price is here in the zone, im not comfortable entering a buy order yet. The full bearish candle into the zone, leaves me with an indication that price may go lower. +ve: 1. Big bearish candle in to the BoS zone - price may drop lower 2. There is equal low liquidity on the left...
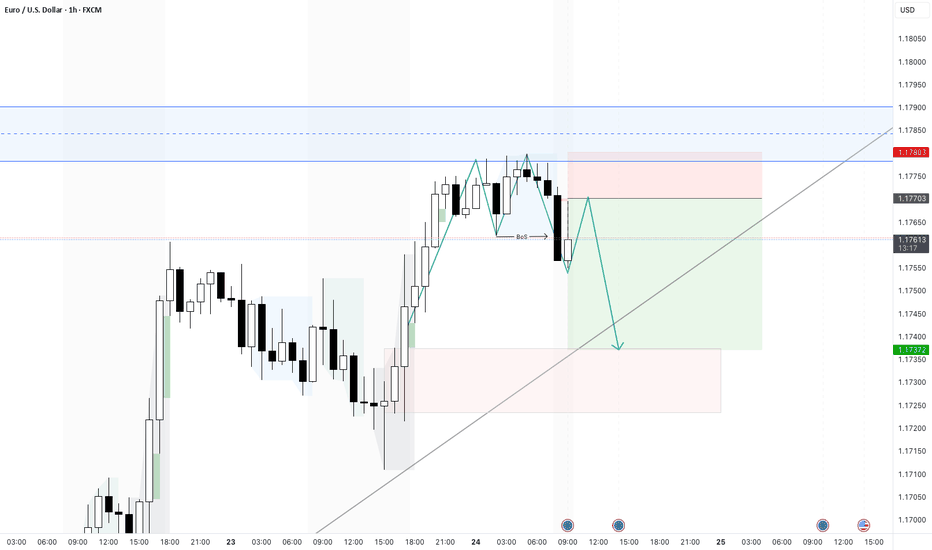
There was quite strong bearish momentum yesterday during the US session. Going into Asian session and London session today there is a consolidation bullish. There is a 4 hour zone marked out where i am looking for a retest and continuation bearish to a key zone below where a reversal pivot is expected and then continuing bullish with the larger trend.
Yesterday price touched a HTF demand zone that i marked out and on the 1 hour formed a break of structure. This is as per my plan a pivot ore reversal sign. Now trying to find an entry its trickier. Initially i wanted to enter higher up at the green imbalance that is there, but i noticed equal low liquidity marked as $$$ which i will assume will be taken out. I...
I dont normally trade USDJPY but i see a setup based on my strategy. The price was climbing to take out a previous high on the 4H and Daily TF. But on the hourly there is a clear BoS which suggests that there may be a pull back even though the HTF bias is still bullish. +ve: 1. there is a BoS on the 1 hour chart 2. Equal low liquidity just below which will...
I do have a bullish trade open current from this zone, but will move the SL to breakeven or take a small loss. The new idea if the equal low liquidity is swept is to take a bearish trade as shown.
Watching DXY i noticed some string bullish momentum in the dollar. As a result it looks like gold may have continued weakness today. I see a pivot formed on the 15in and taking a bearish trade to the hight time frame liquidity equal levels below.
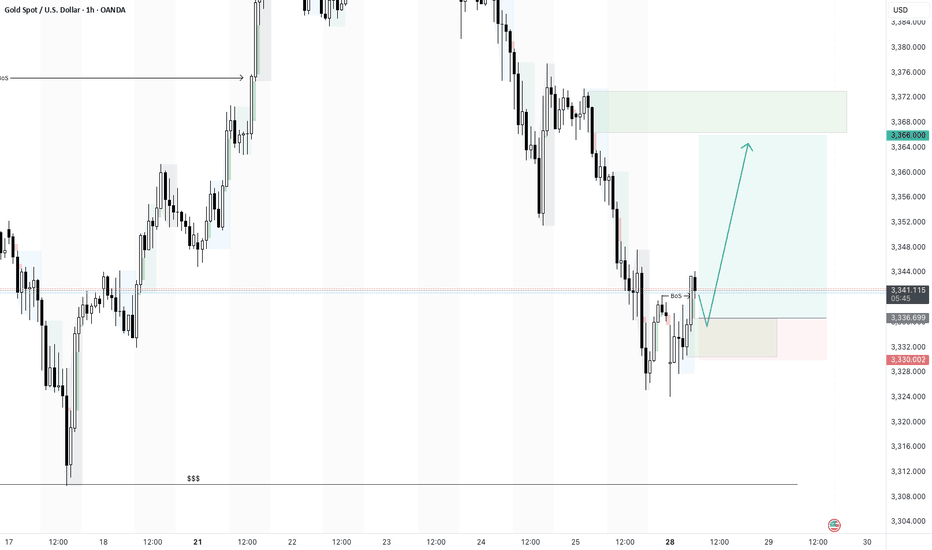
Based on the 1hr- there is a break of structure and i am looking for a bullish move this morning. There is a chance that this trade fails as there is a 4hr equal low liquidity below which could draw the price to. Im still going to take this trade and let price do its thing today.
I highlighted the equal liquidity zone and places a buy limit order. This has been triggered and now will see if it holds.
Price failed to break through the supply zone above that was identified on the higher 4hr and 1hr TF. The last unmitigated zone is highlighted in green and looking to take a short from there to the next low. There is equal level liquidity below that will draw price there. In addition the HH is just a wick giving me more confidence that there is weakness in...
Gold did touch the higher timeframe supply zone and pull back. It is now at a point where i am looking for a pivot to form to continue bullish. I did place a buy limit trade at the extreme zone that started the break of structures. i will wait a see if it drops and triggers or forms a pivot at the 4H zone that broke structure.
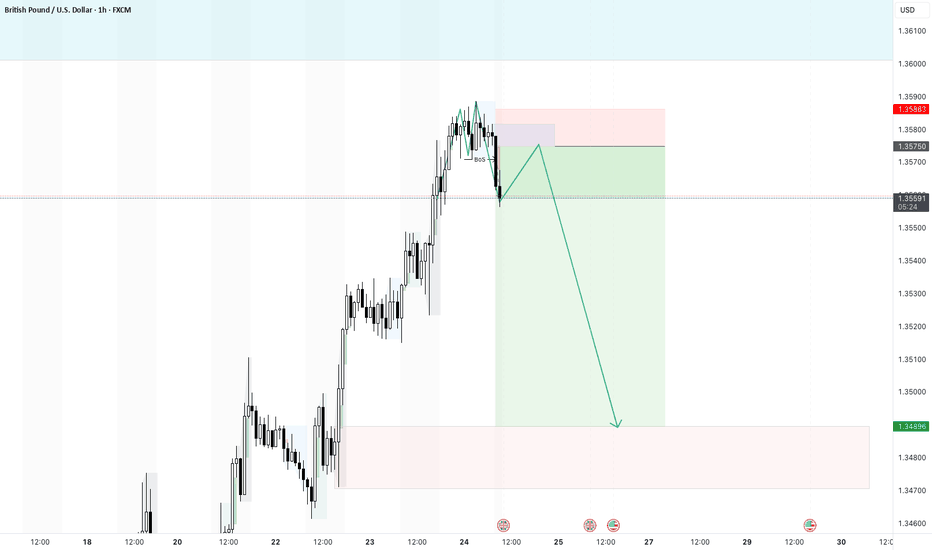
Price touched a supply zone and formed a break of structure on the 1 hour. I may have missed the entry, but i placed a sell limit with a TP to the imbalance below.
The clear break of structure gives me confidence that a short trade is possible today. Ideally i want a retest of the imbalance and then a push down. My TP is quite far at the moment and i may take profit earlier or move my SL.
Based on 4hour timeframe - Gold dropped beautifully over the last few days and has reached the demand area that caused the break of structure. - there is still weakness but for a day trade i would like to see a reversal on the lower timeframe at this point - the price pushed down during the asian session and not waiting for the reversal on the lower TF that...
DXY retested the gap formed at the beginning of the week. The area of demand had efficiency underneath it - price swept the efficient zone, and closed in the identified zone. Price is currently bullish, but I would like to see price close above the 100.53 mark before looking for a buy trade.
I made a trade earlier where i though the bring was breaking upwards, only for the price to reverse. So i "Flipped the Switch" but looking for a bearish entry. A large bearish candle closed below the consolidation zone - i am looking for a bearish move. Target will be the recent low that at 1805ish. Disclaimer: I am by no means a professional trader, but an...
I took this trade this morning and resulted in a nearly 6R win. Price broke the major upper support (blue line) that was being respected since November. Once this price broke this support i looked for a short entry at 1793.4 with a stop at 1796. Price pulled back as expected and ran down to my target of 1777.96 - which is aligned with the last touch point of...
XAU just experienced a major bullish rally after the release of the CPI report and has been bullish for the 2 months. This consolidation into a triangle pattern after the bullish rally just had a breakout. My initially temptation was to jump in on the 5min chart breakout, but I have been making rash decisions recently and been whipped out far too often. This...


