Asma7assan
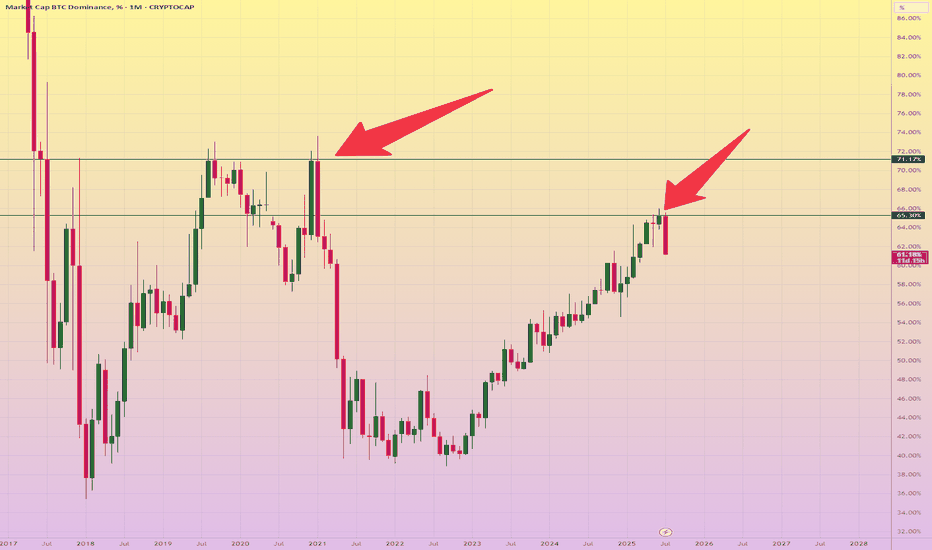
PremiumFinally!!! What we want and need to see! BTC dominance falling from 65%! If you look back at 2021, BTC dominance was the highest at 71%, but then dropped significantly — making altcoins the major money-making machine. Expect the same, my beloved followers! I can’t wait for us to enjoy this ride together.
We exceed 1.46T its end game for bears, money will flow into altcoins like no other! Another hysterical rally something similar or even harder than 2021! and I cant bloody wait!!!!! Exciting times ahead of us! LFGO!
Selling wick on the 12-hour candle confirms strong resistance around the $96K– GETTEX:97K zone. We may see a short-term dip towards $95K–$94K, but it’s really nothing to worry about. While BTC searches for support, altcoins are likely to take advantage of this consolidation phase and rally. I don’t expect BTC’s short-term movement to significantly impact...
MACROSENTIMENT Macrosentiment Analysis – BTC/USDT Current Market Structure: Bitcoin appears to have found a strong bottom around the $74,000 level, which historically has acted as a key support zone. This area was anticipated months ago as a likely retest zone in the event of a correction — specifically between $70,000 to $75,000. We are now beginning to see...
Bitcoin has finally broken above the tough resistance level at $95,000 , a level we’ve struggled to conquer for the past 15 days. It's now trading around $96,800 , and the bullish momentum appears to be building. I believe this momentum could carry the price beyond GETTEX:97K – GETTEX:98K , potentially leading us to the next major resistance zone at ...
📊 Altcoin Market Cap Analysis (Excluding BTC) Date: 9th April 2025 We're currently observing the total market cap of all altcoins (excluding Bitcoin), which has historically shown a consistent pattern around the $700B demand zone. This area has repeatedly acted as a launchpad for significant altcoin rallies, marking the point where new capital tends to flow into...
BTC's Resistance and Support Levels Resistance: 104K Immediate Weekly Support: 98K I won't call a bear market until we see prices drop to 94K—and most importantly, to 90K. BREAKING BELOW 90K, I WOULD BE READY TO CALL A BEAR MARKET! Currently, BTC is consolidating between 94K and 104K, which is exactly what I've been hoping to see. I was also expecting that this...
Analyzing BTC.DOMINANCE I am observing a doji candle forming on this week’s chart, which could indicate that the top is in for BTC.D and that we might start seeing a decline within the next 1 day and 11 hours. For altcoin trading to become viable, BTC.D needs to drop toward 56%. I lean toward the view that BTC.D will begin to fall and that altcoins will gain...
I’m not calling it a bear market until we lose 90K! So, you won’t hear those words from me just yet. What I’m saying, though, is that the market could start to come down painfully slow. **February is the make-or-break month!** **If February opens green, it signals the bulls aren’t done yet and still have the strength to push higher. **However, if February...
Every year before the altcoin season, we observe a familiar pattern: BTC dominance (BTC.D) rises significantly, then drops sharply, creating room for altcoins to rally. 2018–2020: BTC.D peaked at 72%. 2021: BTC.D dropped from 72% to 39%, sparking an incredible altcoin season. We seem to be in a similar cycle now! 2022–2023: BTC.D rose from 40% to 60%....
Bullish Scenario: If 90K holds as a major monthly support, we may not see a retest of that level. In this case, the price is likely to climb toward 107K, breaking the 2024 all-time high (ATH). Bearish Scenario: If 90K fails as major monthly support, it could lead to a significant drop. Potential targets include 87K, 80K, 75K, and even 70K. Market Sentiment:...
Personally, I don’t think this scenario will play out, but as traders, we always need to consider two possibilities to gauge the likelihood of each unfolding. This is my bearish scenario if we lose the 95K support. The next support level would be at 92K, followed by an oversold bounce toward 99K-100K. This bounce might deceive people into thinking the bottom is...
In my opinion, this scenario is the most likely to play out because bulls are showing strength even during dips, indicating they’re not ready to stop buying yet. Here’s what I think will happen: We bounce off the 96K-97K support , forming a strong long-buy wick candle , which sets the stage for the next week (starting December 23rd) to turn green. I’ve...
MACROANALYSIS (ZOOMED OUT CHART) If you forecast using the fib-time zone tool you will realise that the next bull market top will roughly be around 200K Those fib time zone are playing out to the dot. With every line projected we are seeing a change in trend direction If this analysis continues to play out, we could easily see a bull run second half of 2023...
TARGET 2.5 (84% PROFIT) all timeframes are bullish, from monthly, weekly, down to daily. We had a a break above the neckline so its only expected that we climb higher
Another attempt to break through 25K and we all know that the more we test a level, the more likely we break through it. so this is going to be the 8th time on the daily timeframe we try to break through 25k but failed. for me, I already believe we are going to break it and continue to 30K (21% PROFIT), its a 90% probability for me.
If we lose 23K, then it could be bad news for us as that would force the month of March to turn red. so far its green and we are good so long bull volume continues. so I'm ready to exit all of my positions if we lose 23K So far im still bullish until 23K is lost


