AvalonKnight
tomorrow until 2-4 days i predicted usdchf going to bearish, dont forget, use always stop loss maximum 60 pip
you see that, yesterday i write for usdcad, and if you want to hold, you can get 1500Pips++ (5 digits) or 150 pip (4 digits)
And now USDCAD is on the top higher price area so now u can sell now, see my pattern
Yesterday i write for EU pair and then finish like i planning, today i write again for GU pair so you can try at demo, or follow my pattern in your real account and use stop loss maximum 50 pip (4 digits) or 500 pips (5 digits)
Yesterday i write n find this pattern at EU pair but not found, until this day in time frame 15, is taking profit until 1500pips (5 digit version) or 150pips (4 digit version)
i found it pattern for plan march 23 2020, you can believe or not its ok 4 me, try in demo first
i found pattern at pair GU, in the time frame h1, formation harmonic pattern "M" it's mean that bullish but very short, because poundsterling underpressure about brexit and global epidemic covid-19
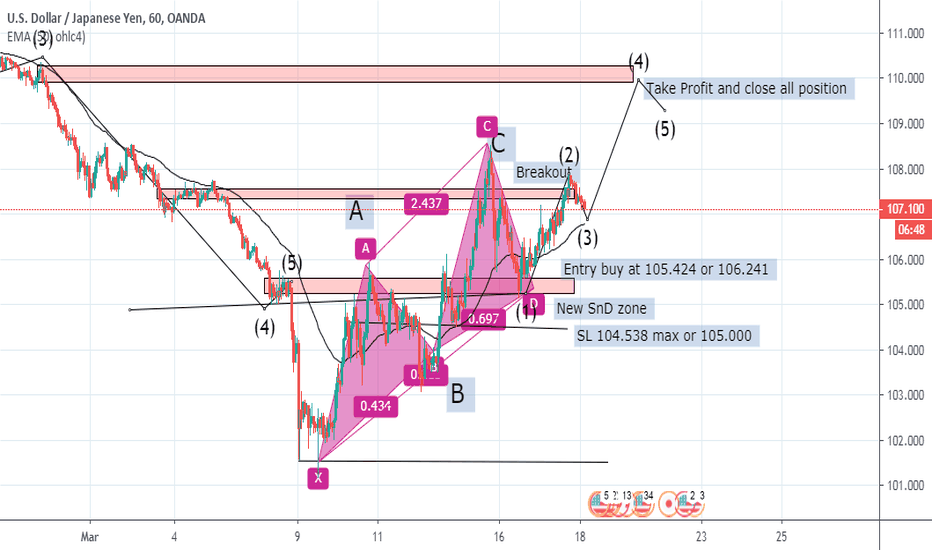
Yesterday i explained before, market going to impulse from wave 4 to wave5 , as u know wave 5 is euphoria,the market not to far like wave 3, maximum profit taking is 112.000 after that close position cause the market going to correction wave
For now i just draw in EU pair and not for opening position, if my predictable is right this market make irrengular pattern, take a look my drawinng at right upperside, because now the market has entering correction wave
yesterday you se my pattern and now the market went according to my plan
Yesterday you can see my write at link and now USDJPY has entered impulse wave now and u can see Taking profit in my pic
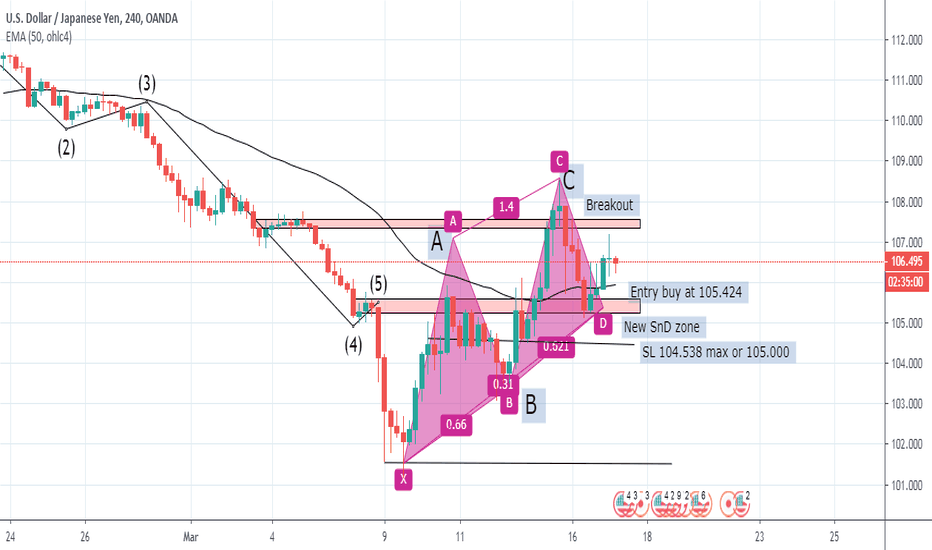
pada time Frame H4 market telah melakukan breakout di area wave dan kembali ke area A dan B namun persiapan n untuk bullish telah terkonfirmasi in tme frame h4 market has been breakout in fresh SnD so market bearish again until break betwen area A n B so u can buy it. average area 105.300
at least in time frame h1 this market harmony pattern "M"
yep as u know GU going down to support 1.21000 in time frame D1 but in time frame h4, market has sideways for tomorrow monday March 15 2020, if not fundamental critcal, this market going as my plann.
saat ini market menuju pergerakan dengan pola dobel flat triangle, dan memang sedang tren bearish, EMA 50 diatas market menandakan tren bearish masih berlanjut 4 now, EU pair flat double triangle at m15, just wait n see , after correction going back to impulse again
untuk EU memasuki fase triangle koreksi


