Bathes25
EssentialWe can a clear bullish structure forming after a series of higher highs and higher lows, indicating bullish momentum building. Recently, price rejected from a key swing high and appears to be pulling back. This pullback is targeting a Fair Value Gap (FVG) marked in the blue zone then bounce from the FVG zone back toward the overhead Liquidity Zone.
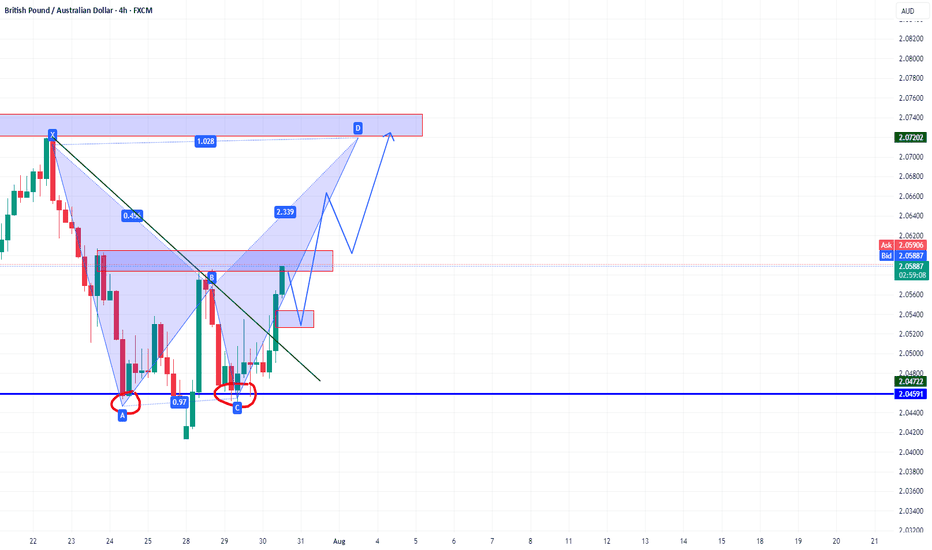
GBPAUD is showing bullish potential after forming a double bottom around the key support zone at 2.0459. A bullish harmonic pattern is unfolding, with a potential move toward the 2.0720–2.0740 resistance zone. The break of the downtrend line adds confirmation, and a pullback to 2.0530–2.0550 could offer a good re-entry area. As long as price stays above 2.0450,...
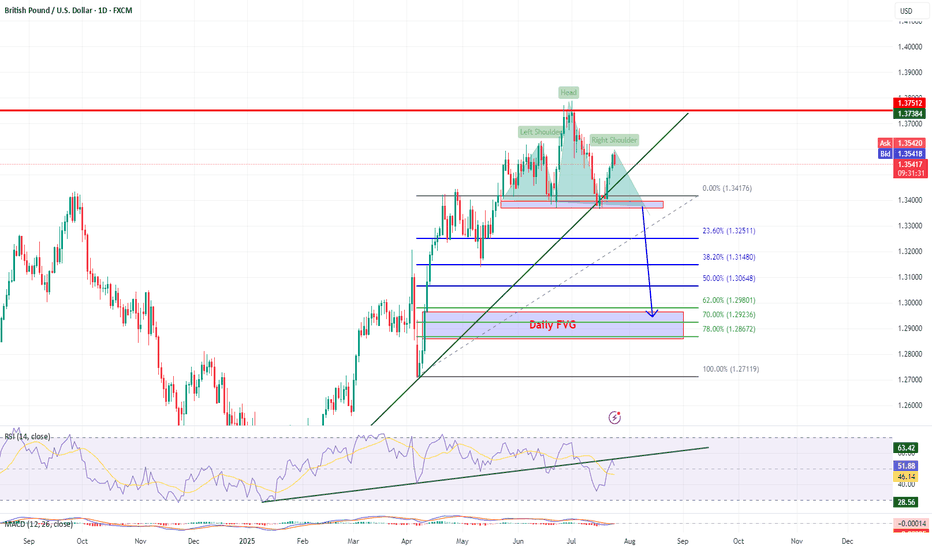
The GBP/USD chart is currently exhibiting a potential Head and Shoulders reversal pattern, which has formed near a significant daily resistance level. Price action shows a rejection from the right shoulder area, aligning with historical supply. Additionally, there is a clear break of the RSI trendline on the daily timeframe, followed by a retest and continuation...
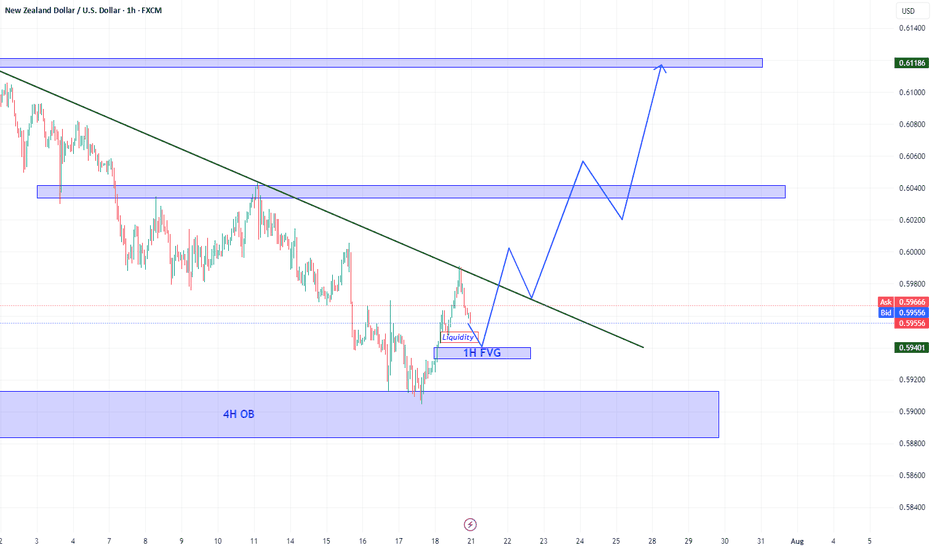
The main direction is bullish -Price has rebounded from the 4H Order Block (OB), showing strong bullish intent and forming a Change of Character (CHOCH). - Currently, the price is pulling back and is expected to retest the 1H Fair Value Gap (FVG) around 0.5940–0.5947, which aligns with a liquidity zone. - A successful rejection from the FVG followed by a break...
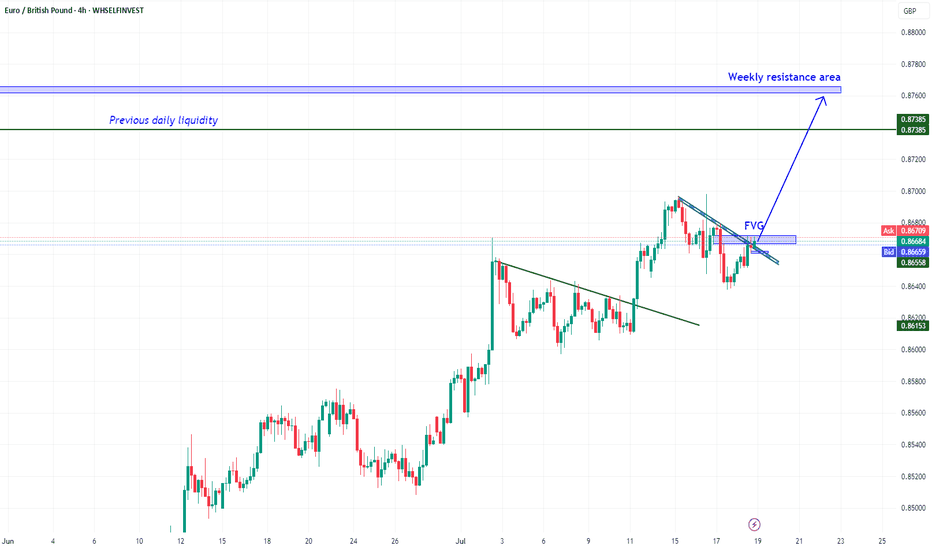
The pair is currently maintaining a bullish structure after breaking above the descending trendline. Price is approaching a Fair Value Gap (FVG) zone, which acts as a short-term resistance. We are anticipating a bullish continuation, but confirmation is needed. A 4H candle close above the FVG zone will validate the breakout, turning this FVG into an Imbalance...
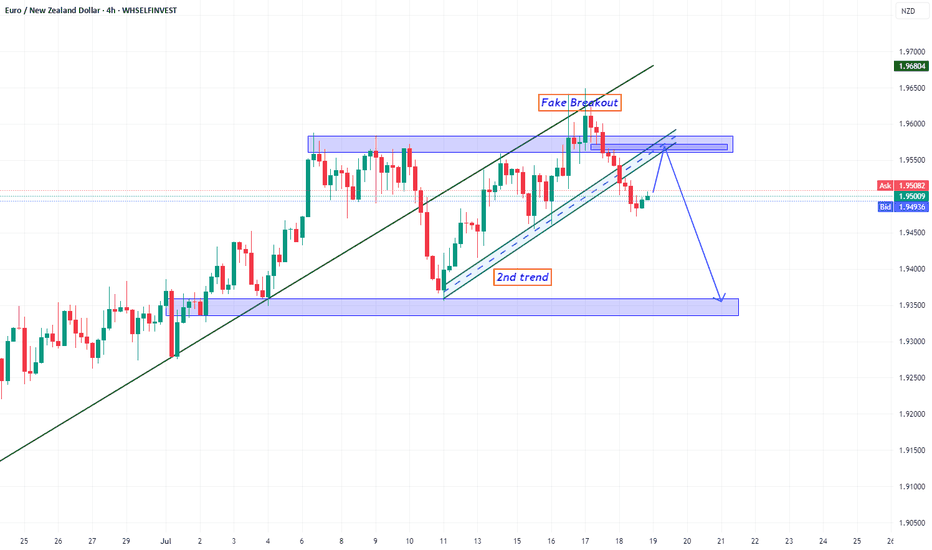
Initially, the price rejected the resistance zone and broke below the 4H ascending trendline, signaling a potential shift in momentum. It then retraced back to the resistance area, executing a false breakout, followed by a retest of the broken trendline — a classic liquidity grab setup to fuel further downside movement. This retest generated strong bearish...
My expectation for CADJPY is that it will rise toward the 108.38–108.55 zone to sweep previous liquidity, then potentially reverse and drop into the Fair Value Gap (FVG) area below. You can sell now and reinforcement on the top
GBPAUD rebound from OB with sweep liquidity Target 2.0614
Price will rebound from FVG area which never touch before , Target next liquidity area.
Price Reject from Strong resistance zone and uptrend is broken also price rebound from 1H FVG. We are looking for sell target 2.0533, stop loss 2.0982
This is a swing bullish deal. Trouble bottom pattern and on a daily it Bullish Bat/Crab pattern. You can enter from the current price and stop loss 103.75 and target 110.413
The main trend is down. The price rebounded from IFVG. We are waiting for a liquidity sweep and rebound from FVG. Target 1.3162
There's a clear descending triangle with price testing the upper resistance. A breakout is anticipated. You can enter from FVG (Stop loss 0.83230)or wait a breakout above the triangle, then retest. We have two targets: -The distance from the highest point to the support line which will be at 0.8522 -Second target will be swing deal take it on weekly IFVG which...
Price is likely to return to a strong rejection area, which is significant due to the presence of both an Order Block (OB) and a Breaker Block. This confluence makes it a key supply zone. Additionally, this area may potentially form the right shoulder of a developing Head and Shoulders pattern, suggesting a possible bearish reversal from that zone."
Price broke above the minor resistance at ~189.50 and appears to pull back to OB for a bullish continuation toward the next significant resistance zone (~195).
My analysis for CADJPY expect that price will move down to take liquidity at Point A. Following this liquidity grab, I will be looking for confirmation signals of bullish momentum. If confirmed, the first profit target would be within the Fair Value Gap (FVG) at Point B, second profit target would be the liquidity level at Point C.
We have high opportunity for bullish because of: -We have Bat harmonic pattern. -Have a downtrade channel which broken before touch lower side. -The price bounced back from liquidity area.

