Bixley2
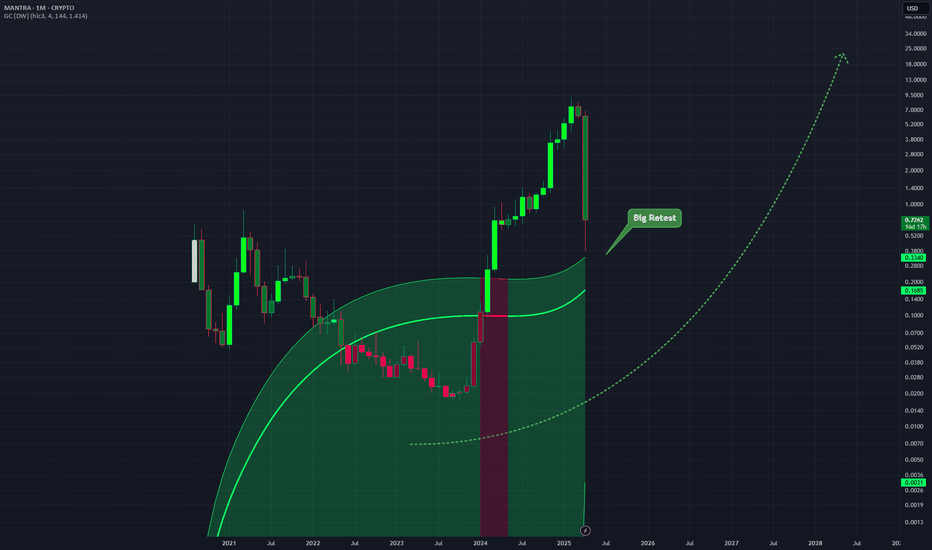
On the monthly chart this dump is shown as just a retest of the Gaussian Channel indicator which price is still above. Very big move which could shake a lot out. If you are long on this Monthly you should not be very worried. Unless the intensity of the downward move is too much. Monthly chart.
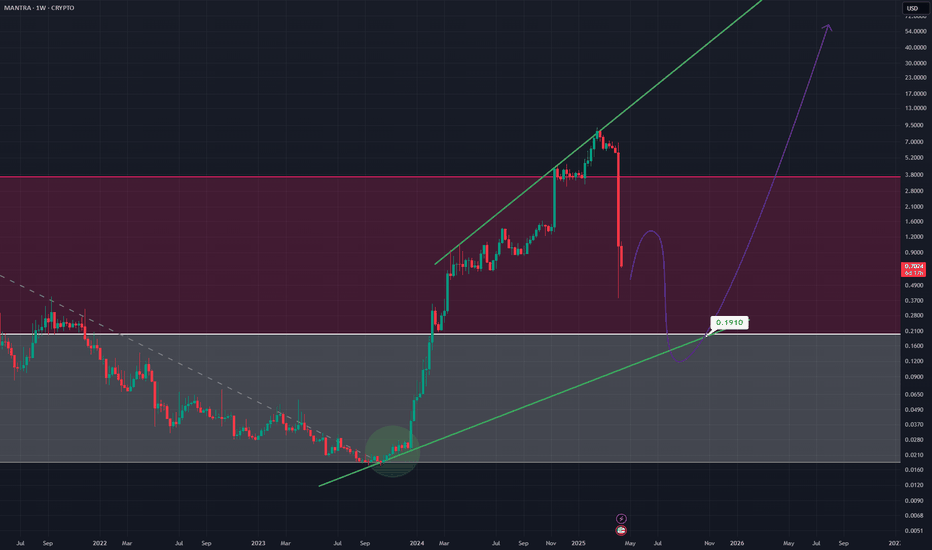
A massive move downwards on this Weekly timeframe I think still however support can be found and the overall upward phase on the longer term trend line can resume Could be a massive buy the dip scenario Reminds me in some ways of the LUNA crash however I would wait till the the price label point is hit before entering on this long timeframe
A long term trend line on the SPX Great place to buy if you are speculative of the current price movement Price from this line will most likely move up If not up from this trend line, very bearish. Great time within a bear market to buy oversold stock regardless. Just have to HODL. If bearish HODL .
A symmetrical triangle in my opinion that will lead to a breakout for the bulls This is on the Weekly chart Bullish during the alt season when it begins
DJI showing a rising wedge which is a bearish pattern on this Daily chart Also right before the prior down movement is a double top in red Breakdown further out of this rising wedge pattern
An idea suggesting that current actions by trump have induced a massive sell off situation With losses coming in comparable to that of the 1920 depression I think we are very over extended a pull back is necessary Yearly chart
A falling wedge pattern which is a bullish pattern This is on a long timeframe being the daily I expect price to break out to the white dotted line Daily timeframe
A large symmetrical triangle on this daily timeframe These tend to break out bullishly, being a bullish pattern Bullish on this Daily
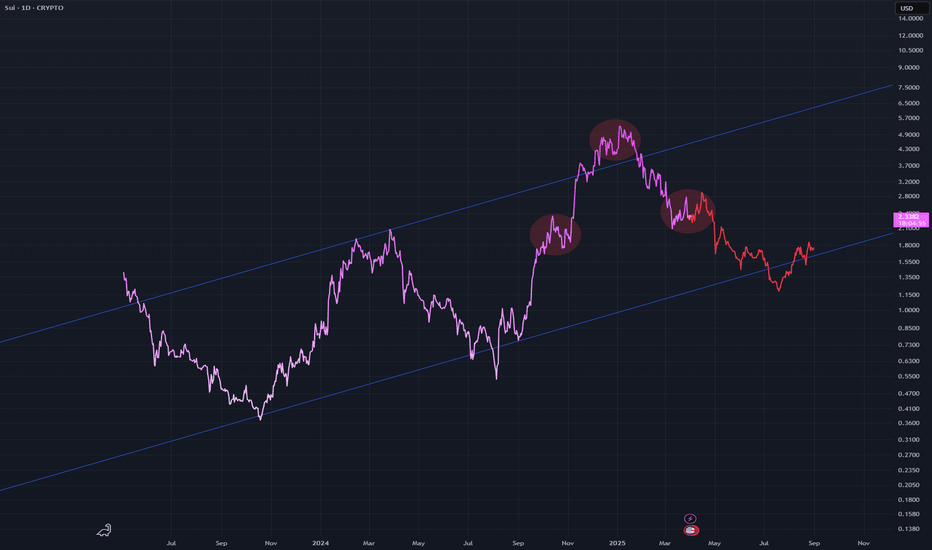
Return to the blue trend line with a sharp bear move I have shown this move in red, price forms a bottom along the blue line White dotted lines show the overarching bear channel/trend Daily chart
A double top will push price down to the bottom of this channel in blue From there price can form a bottom and start to head upwards rapidly once the bottom has formed The double top is responsible for the current downward move Daily chart
Some strange price action on this chart which i have labelled with the up arrow Not sure whether this action is positive or negative Expect to see a breakout of this larger descending triangle structure Daily timeframe
This line has been seen as a prior resistance line but is now seen as support in the green circle I believe that this is the beginning of a bull move for this coin, that there is more to come, which I have shown with the double curve. Resistance turned support. Daily timeframe
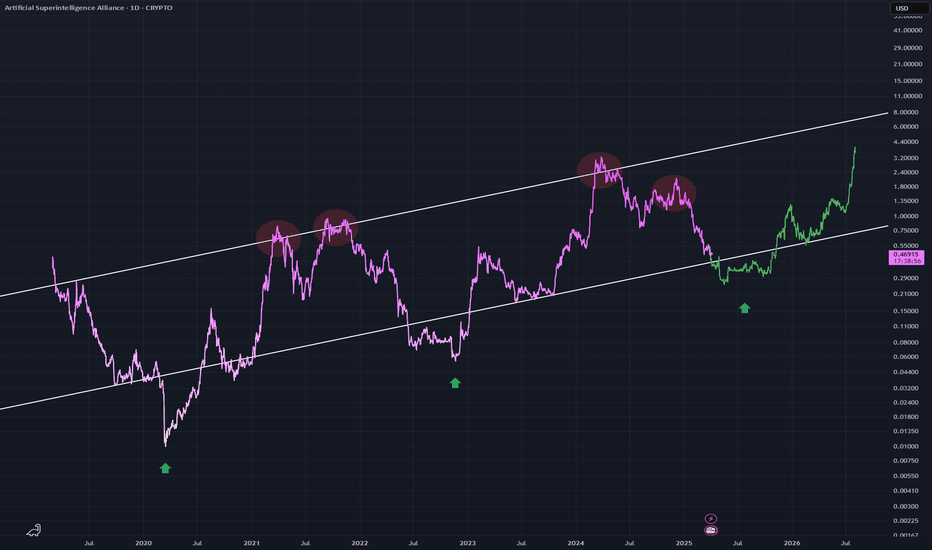
Showing my thoughts with the bars pattern tool in green The red circles contain two double top patterns I expect price to recover below the lower white line and then move back up into the channel following short term time below this white channel Daily timeframe
Falling Wedge in blue along the down trend in white Falling wedges break out bullishly This bullish break out will be the first real bull run for this coin Not sure how high it could go, should go beyond previous ATH though Daily timeframe
A nice bullflag that could extend price into the $100 range This aligns well with an upper trend line in blue that could act as resistance Have used the bars pattern tool in green to show my thoughts Daily timeframe
A head and shoulders pattern that allows the creation of a slight up channel in blue Circles in red show the head and shoulders pattern Daily timeframe
Up trend in blue that is currently being tested, i expect a strong bull move off this up trend line Using the dotted white line an ascending triangle can be plotted This is the daily chart for BNB
A falling wedge idea I think the down trend in white will be retested before the true breakout After that the falling wedge pattern can act on its bullishness Daily chart


