BullBearInsights
EssentialSPY Slips into Deep Negative Gamma — $629.73 Pivot Under Siege 🔍 GEX & Options Flow Insight (1st Image Analysis) SPY has rolled over sharply from the $641 highs, slicing through multiple support zones and now probing the $629–$631 gamma pivot. The GEX structure is decisively negative, signaling elevated downside risk if this key level fails. * Call Walls &...
TSLA Downtrend Deepens — Key Gamma Floor at $300.41 Now in Sight 🔍 GEX & Options Flow Insight (1st Image Analysis) TSLA continues to grind lower, breaking multiple gamma supports and staying pinned near the $306–$307 zone. The GEX profile shows a clear negative gamma environment, which means dealer hedging flows can intensify moves in either direction — but right...
PLTR Pressured at Key Support — Can $155 Hold or Is a Break to $150 Next? 🔍 GEX & Options Flow Insight (1st Image Analysis) PLTR has been sliding after failing to hold its $160+ range and is now testing the $155–156 gamma support. The GEX profile still shows moderate call dominance, but support is thin below this level, meaning a break could bring swift...
GOOGL Slips into Bearish Gamma Territory — Eyes on $190 Defense or Slide to $187.50 🔍 GEX & Options Flow Insight (1st Image Analysis) GOOGL has broken down from its recent consolidation and is now testing the $190–$192 gamma support band. The GEX profile shows heavy negative gamma just below current price, increasing the risk of accelerated selling if $190...
AMZN Earnings Flush — Gamma Flip to the Downside, Eyes on $215 Support! 🔍 GEX & Options Flow Insight (1st Image Analysis) AMZN collapsed post-earnings, breaking through major gamma support levels and flipping into a negative gamma environment. Price is now pressing against a critical $215–218 demand zone, with GEX showing heavy put concentration. * Call Walls &...
MSFT Post-Earnings Surge — Consolidation Before Another Leg Up or First Sign of Exhaustion? 🔍 GEX & Options Flow Insight (1st Image Analysis) Microsoft exploded higher after earnings, reaching the mid-$530s before pulling back slightly. It now sits between strong gamma support and a major Call Wall cluster, indicating a consolidation phase that could lead to...
META’s Monster Gap — Gamma Ceiling at $785 or Room to Run Past $800? 🔍 GEX & Options Flow Insight (1st Image Analysis) META ripped higher on earnings momentum, gapping from the $690s into the $770s, and is now stalling just under the Gamma Wall / Highest Positive NET GEX at $784.69. Options positioning shows bullish gamma support but overhead resistance could...
SPY Back from the Dead! Gamma Reclaim or One-Day Trap? 638 is the Battleground 🔍 GEX & Options Flow Insight (1st Image Analysis) SPY surged off strong PUT support at ~630 and is now pressing into the CALL Resistance wall at 633–634, with upward momentum and a surprising gamma flip. However, it's running right into a stacked supply zone just below the next big...
AMZN Launches Out of Trap Zone! Will Gamma Push Us to 245+ or Fakeout from Supply? 🔍 GEX & Options Flow Insight (1st Image Analysis) AMZN broke out aggressively from a coil and is now trading at $237.50, right under the Gamma Wall and 2nd Call Wall. Gamma positioning shows bullish momentum potential, but current price is sitting just beneath the highest...
NVDA Explodes into Gamma Cloud! Squeeze to $187 or Pullback from Supply? 🔍 GEX & Options Flow Insight (1st Image Analysis) NVDA just broke through major resistance and is trading at $183.35, sitting in the middle of stacked Call Walls and a strong positive GEX zone. Gamma positioning is highly bullish—but a stall near current levels is possible as dealers begin...
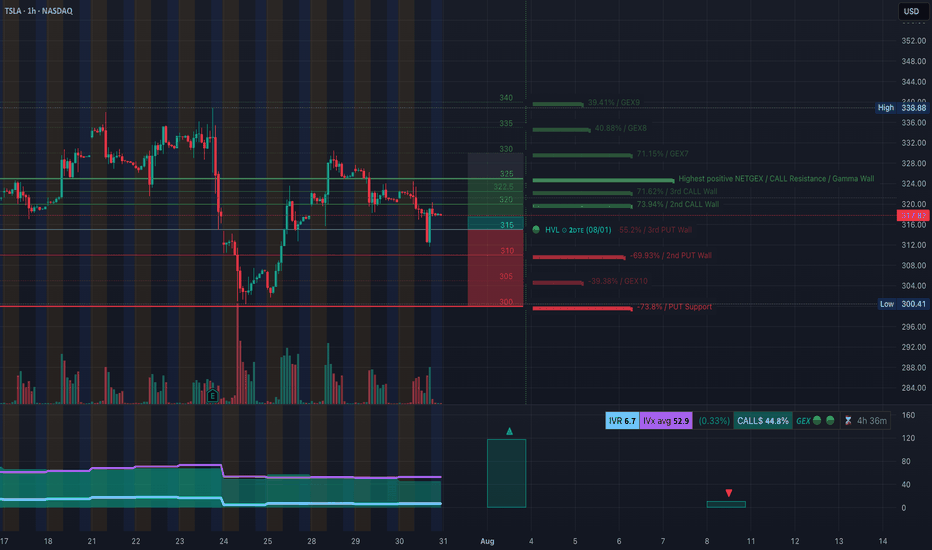
TSLA Breaks Bull Structure — Gamma Trap or Breakdown? Watch 315/300 Closely! 🔍 GEX & Options Flow Insight (1st Image Analysis) TSLA is trading at $317.82, having just lost support at the 2nd Call Wall ($322.5) and now hovering near key PUT Wall clusters. Options positioning reveals strong downside pressure unless bulls reclaim 321+. * Call Walls / Resistance: ...
PLTR Breaking Out or Bull Trap? Options Flow Says Bulls Might Win! 🔍 GEX & Options Flow Insight (1st Image Analysis) PLTR is pushing into key resistance around $159.77, just under the 2nd CALL Wall at $161.44, with massive gamma clusters building overhead. Here's the breakdown: * Call Walls & Gamma Resistance: * 📍 $159.77 → Current wall that price is testing ...
GOOGL Eyeing Gamma Squeeze to $202? Smart Money Sets the Trap! 🔍 GEX & Options Flow Insight GOOGL is trading around $196 and sitting just under the 2nd Call Wall at $197.5, with a visible Gamma Wall / Resistance around the psychological $200 level. Here's how GEX is positioned: * Call Walls: * 📍 $197.5 → Current hot zone (2nd CALL Wall — 91.21%) * 📍...
SPY at the Edge of Breakdown or Bounce? Watch These Gamma & Structure Levels Closely 🔥 🔹 GEX Insights for Options Trading (1H GEX Chart): SPY currently sits at $635.43, hovering just above the highest negative GEX level at $635, which often acts as short-term PUT support or a reversal trigger when price reaches exhaustion. The most concentrated CALL gamma cluster...
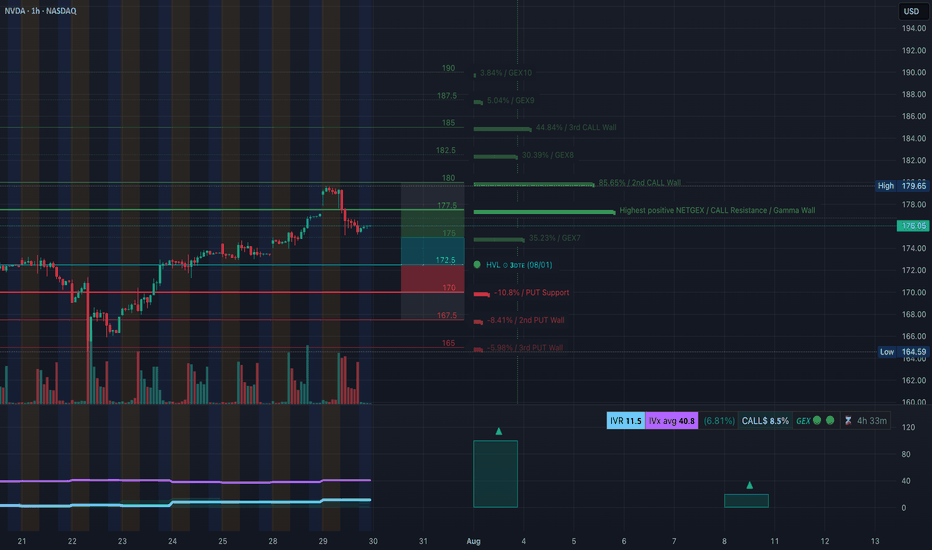
NVDA Rejection From Supply! Will Gamma Walls Trap Bulls Below 178? 🔥 🧠 GEX-Based Options Outlook (1H GEX Chart) NVDA currently trades around $176, just below the key Gamma Wall at $178, which aligns with the Highest Positive NETGEX zone and a Call Wall cluster between $178–$180. This setup suggests that any move above $178 will face strong gamma resistance, and...
AMZN Breakdown in Progress! 🔍 GEX Insights & Options Trading Thoughts (1H Perspective) Amazon (AMZN) is transitioning from a distribution phase into a potential gamma-driven selloff, and the current GEX setup confirms that bias. The GEX walls are sharply stacked on the downside, while call walls remain heavy above current price—creating strong overhead...
🔍 Technical Analysis (1H Chart) TSLA failed to hold above the mid-supply zone around 330–335, rejecting cleanly after forming what looks like a double top on the 1-hour chart — a bearish reversal pattern. Price has since made a CHoCH (Change of Character), confirming shift in market structure from bullish to short-term bearish. We now see price hovering just above...
GOOGL Approaching Inflection Point! Will It Hold Above 195 or Break Down to 190? 🚨 GEX Options Sentiment Overview (1H Chart) GOOGL's current price hovers around $195.30, right under a cluster of heavy Call Walls: * 197.5 is the 3rd Call Wall (65.53%) * 200 is the 2nd Call Wall (88.34%) * 205-210 shows diminishing gamma influence but still has meaningful hedging...


